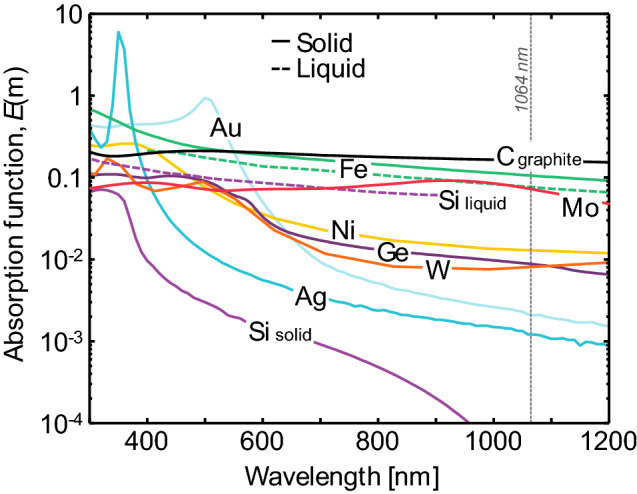
Fig. 7.

Measured (not from LII) absorption functions for a range of metals and metalloids as a function of wavelength. Solid lines correspond to properties for solids, while dashed lines correspond to liquids. The vertical scale is logarithmic, to emphasize differences in the absorption function in the near infrared. Note the difference between the absorption function of solid (semiconductor) and liquid silicon (metal). Underlying optical properties are
taken from Schinke et al. [112] for solid silicon, Fuchs [113] for liquid silicon, Nunley et al. [114] for germanium, Querry [115] for molybdenum and solid iron, Shvarev et al. [116] for liquid iron, Werner et al. [117] for nickel and tungsten, McPeak et al. [118], for gold and silver, and Djurišić and Li [119] for graphite
