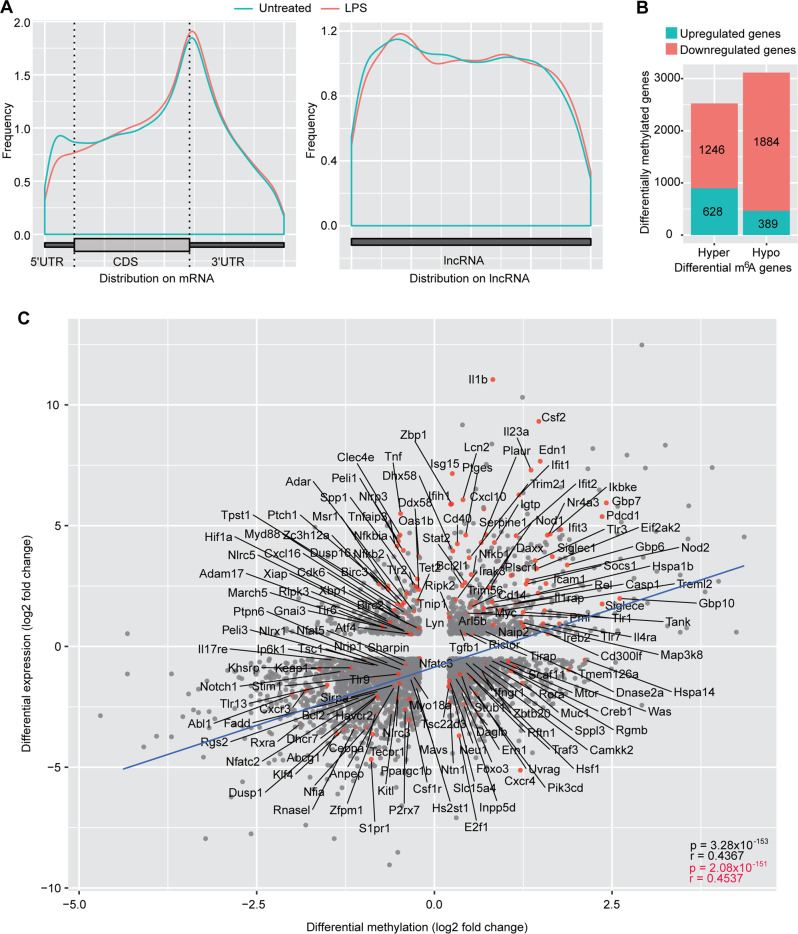
Fig. 2. LPS treatment alters cellular transcriptome and m6A epitranscriptome.
A Overall m6A distribution on cellular mRNA and lncRNA following LPS treatment for 6 h. B Number of differentially expressed genes with hypermethylation and hypomethylation following LPS treatment for 6 h. C Correlation of mRNA expression level and m6A level for differentially expressed and methylated genes following LPS treatment. The regression lines are marked in “blue”. Innate immune related genes are marked with “red dots”.

