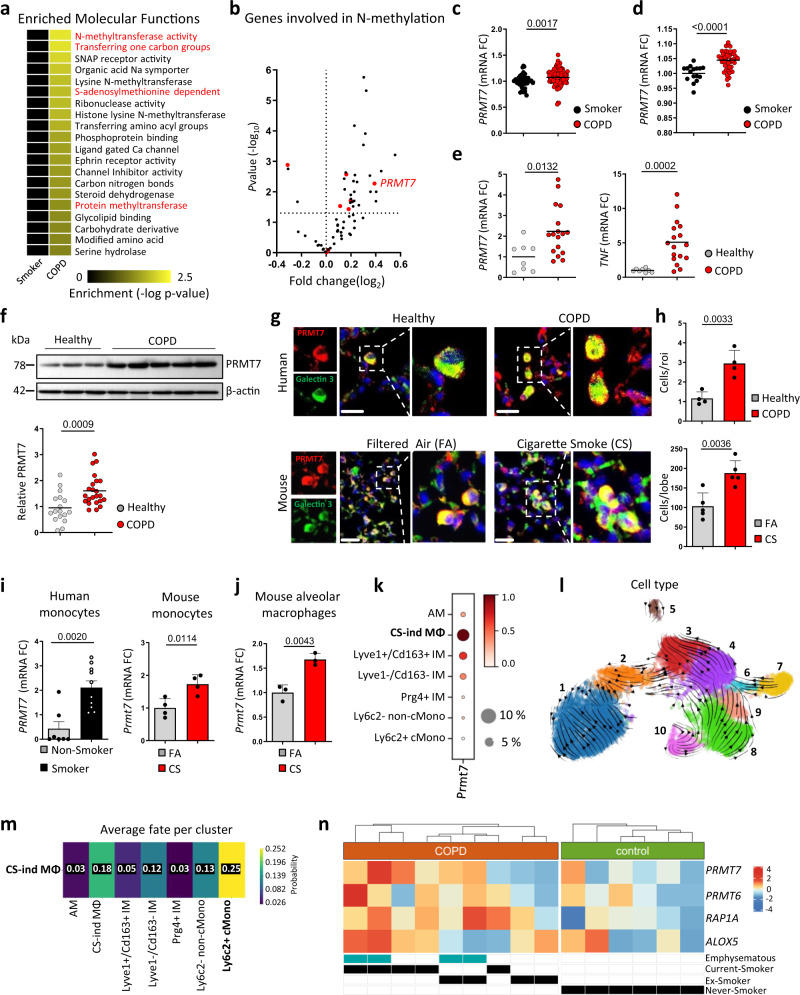
Fig. 1. PRMT7 expression is increased in COPD lungs and localized to macrophages.
a Heat map of the most significantly enriched gene lists in the lungs of COPD patients following gene set enrichment analysis (GSEA) of the GO molecular function set on publicly available array data from lung tissue (GSE76925) of healthy smokers (n = 40) v COPD patients (n = 111). Nominal P value generated by the GSEA software of the enrichment score relative to the null distribution92 shown. b Expression of genes involved in N-methyltransferase activity in COPD patients relative to healthy smokers taken from GSE76925, relative fold change, and P value calculated using the GEO2R interactive web tool running limma R. PRMT genes highlighted in red. c, d Expression of PRMT7, in the lungs of healthy smokers and COPD patients, individuals are shown, expression relative to healthy smokers, taken from GSE76925 (n = 40 smokers and n = 111 COPD patients) (c) and GSE27597 (n = 16 smokers and n = 48 COPD patients) (d). e qPCR analysis of PRMT7 and TNF expression in human lung core biopsies from healthy controls (n = 8) and COPD patients (n = 18) relative to controls. f Western blot analysis of PRMT7 expression in lung core biopsies from healthy (n = 17) and COPD patients (n = 23), normalized to β-actin and shown relative to controls. g Representative images of immunofluorescence analysis for PRMT7 (Red) and the macrophage marker Galectin 3 (Green) in sections from core biopsies of healthy and COPD human lung (n = 4, scale bar 20 μm) and sections from filtered air (FA) and cigarette smoke (CS) mouse lung (n = 5, scale bar 25 μm). h Quantification of double-positive cells from (g). i, j mRNA expression levels of PRMT7 determined by qPCR in human monocytes isolated from blood of non-smokers (n = 7) vs smokers (n = 10) (i) and circulating monocytes (n = 4 for FA and CS) (i) and alveolar macrophages (n = 4 for FA and n = 3 for CS) (j) from B6 mice exposed to FA or CS for 3 days, relative to controls. k–m scRNA-Seq (Drop-Seq) analysis on the lungs of mice following exposure to FA (n = 3) and CS for 2 (n = 5) and 4 months (n = 5). AM alveolar macrophages, CS-ind MØ CS-induced macrophages, IM interstitial macrophages, cMono classical monocytes. k Dot blot depicting Prmt7 expression (log-transformed, normalized UMI counts) and percentage of cells positive for Prmt7 in the myeloid cell compartment. l RNA velocity analysis of the myeloid compartment. (1) AM; (2) CS-ind MØ; (3) Lyve1 + /Cd163 + IM; (4) Lyve1−/Cd163− IM; (5) Prg4 + IM; (6) Ly6c2 + cMono; (7) Ly6c2- non-cMono; (8) Cd103 + /Clec9a + cDC; (9) Cd209 + /Cd11b + cDC; (10) Fscn1 + DC. m Fate probability mapping towards the CS-ind MØ population utilizing CellRank. n Heat map of gene expressions of PRMT6/7, RAP1A, and ALOX5 in monocyte-like macrophages obtained from scRNA-Seq data of bronchoalveolar lavage from COPD patients (n = 9) and healthy controls (n = 6). Mean gene expression per donor is shown as a z-transformed value (across all donors). Data shown mean ± SD and individual patients or mice (c–f and h–j), P values shown in charts determined by two-tailed Mann–Whitney test (c–f), unpaired two-tailed Student’s t-test (h–j). Source data are provided as a Source Data file.

