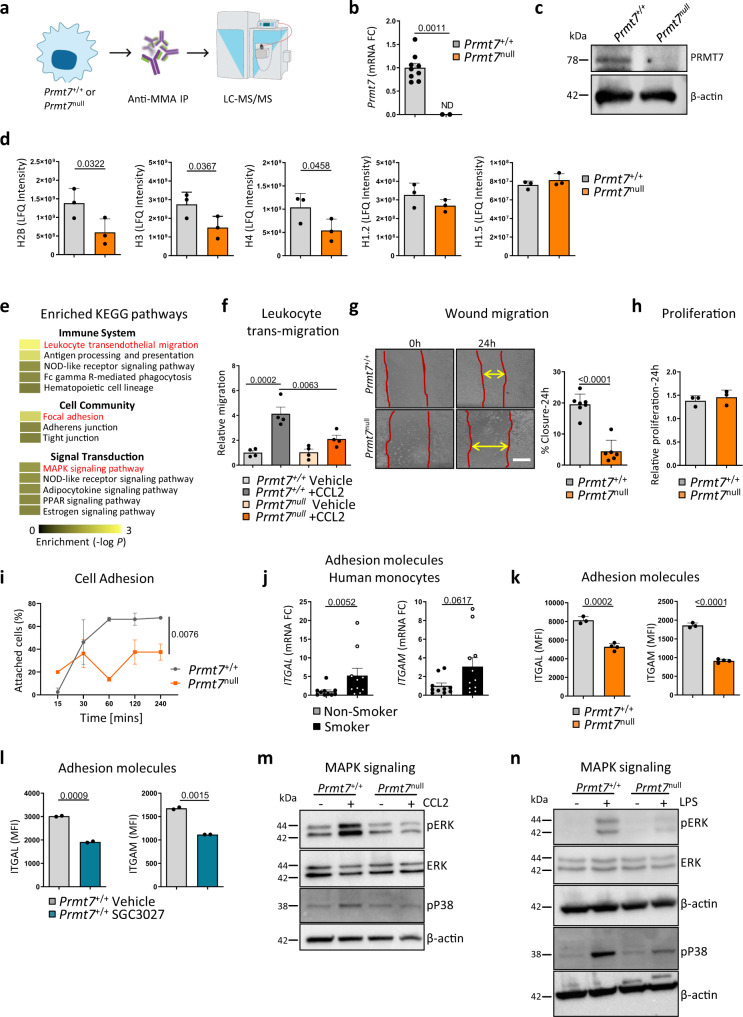
Fig. 2. Loss of PRMT7 results in impaired migration, focal adhesion, and MAPK signaling.
a–d Mono-methylated proteins were immunoprecipitated by anti-mono-methylarginine antibody from whole-cell lysates of Prmt7+/+ and Prmt7null MH-S macrophage cells and analyzed by LC-MS/MS proteomics (n = 3 pull-downs per cell line). a Schematic representation of the experiment. b mRNA expression level of Prmt7 determined by qPCR in Prmt7+/+ and Prmt7null MH-S macrophage cells generated by CRISPR/Cas9-mediated targeting of Prmt7 (n = 9 replicates per cell line, ND not detectable). c Western blot analysis of PRMT7 expression in Prmt7+/+ and Prmt7null MH-S cells (repeated two times). d Immunoprecipitation intensity of core histones H2B, H3, H4, and linker H1.2 and H1.5 (Individual pull-downs shown). e Top enriched KEGG pathways under the immune system, cell community, and signal transduction following InCroMAP analysis of the differentially pulled down proteins with less abundance in Prmt7null compared to Prmt7+/+ MH-S cells (FC <−1.6). P values were calculated using a hypergeometric test embedded in the InCroMAP software, no testing for multiple correction. f The fold change of trans-well migrating Prmt7+/+ and Prmt7null MH-S macrophage cells in 24 h towards serum-free (SF) medium ± 100 ng/ml CCL2 (n = 4, repeated two times). g Wound migration assay in Prmt7+/+ (n = 7) and Prmt7null (n = 6) MH-S cells grown to confluence and scratched. Representative images at 0 and 24 h post scratch plus the percentage wound closure at 24 h (repeated twice). Scale bar, 200 μm. h WST assay of Prmt7+/+ (n = 3) and Prmt7null (n = 3) MH-S cells at 24 h. i Percentage of attached Prmt7+/+ and Prmt7null MH-S cells at the time points indicated post-seeding (n = 2 per cell line, repeated twice). j mRNA expression levels of ITGAL and ITGAM determined by qPCR in the monocytes of smokers (n = 11) and non-smokers (n = 10) isolated from the peripheral blood. k MFI of ITGAL and ITGAM surface expression as determined by flow cytometry in Prmt7+/+ (n = 3) and Prmt7null (n = 4) MH-S cells. l MFI of ITGAL and ITGAM surface expression as determined by flow cytometry in WT MH-S cells incubated with 5 μM SGC3027 (PRMT7 inhibitor) for 24 h and analyzed (n = 2). m Western blot analysis of phosphorylated ERK and p38 in Prmt7+/+ and Prmt7null MH-S cells incubated for 30 min with 100 ng/ml CCL2 (repeated independently two times). n Western blot analysis of phosphorylated ERK and p38 in Prmt7+/+ and Prmt7null MH-S cells incubated for 15 min with 1 μg/ml LPS (repeated independently two times). Data shown mean ± SD, P values shown in charts determined by one-way ANOVA Bonferroni’s multiple comparisons test (f, i), unpaired two-tailed Student’s t-test (b, d, g, j–l). Source data are provided as a Source Data file.

