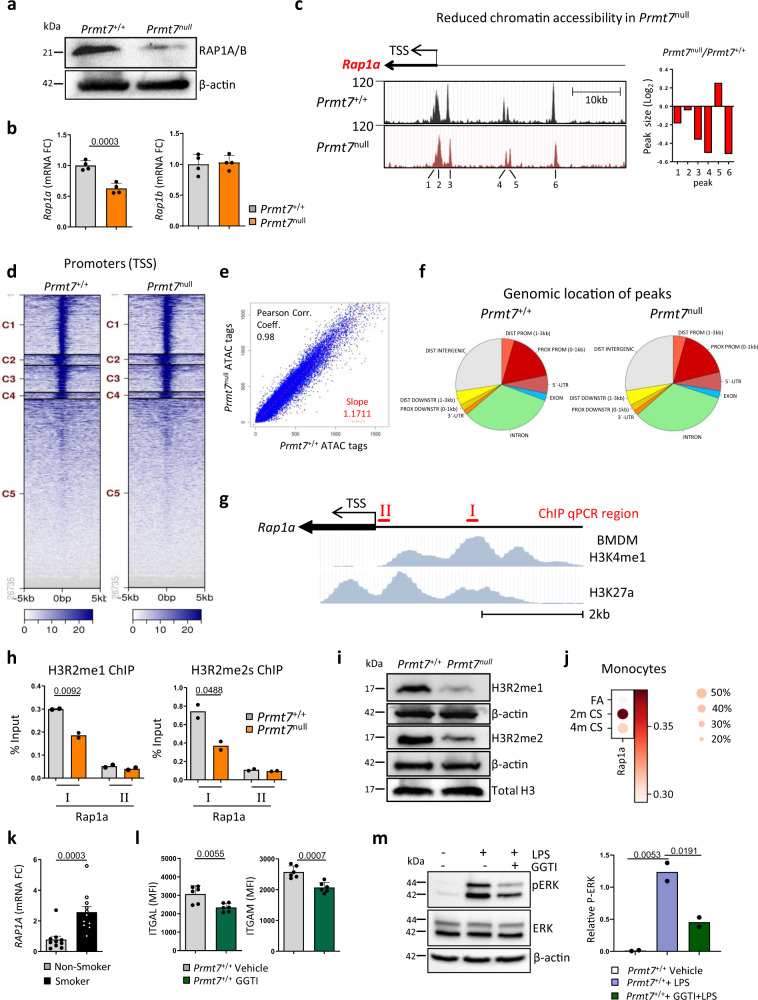
Fig. 3. PRMT7 targets RAP1A expression through histone methylation.
a Western blot analysis of RAP1A/RAP1B expression in Prmt7+/+ and Prmt7null MH-S cells (repeated twice). b mRNA expression level of Rap1a and Rap1b determined by qPCR in Prmt7+/+ and Prmt7null MH-S macrophage cells (n = 4 replicates per cell line). c–f ATAC-Seq analysis of Prmt7+/+ v Prmt7null MH-S cells. c ATAC-seq signal enrichment peaks around the transcription start site (TSS) of the Rap1a gene in Prmt7+/+ and Prmt7null MH-S cells and difference in peak height across the two lines. d Heat map of tag distributions across TSSs for Prmt7+/+ and Prmt7null MH-S cells. e Peak correlation scatter plot. f Pie chart showing the genomic distribution of accessible regions in Prmt7+/+ and Prmt7null MH-S cells. g Schematic representation of the location of the Rap1a regions targeted for qPCR following ChIP, plus H3K4me1 and H3K27a enrichment in BMDM (from UCSC genome browser Track accessions: wgEncodeEM002658 and wgEncodeEM002657). h Enrichment of H3R2 mono and dimethylation at Rap1a regions in Prmt7+/+ and Prmt7null MH-S by qPCR following ChIP (n = 2 per cell line). i Western blot analysis of mono and dimethylation of H3R2 in Prmt7+/+ and Prmt7null MH-S cells (repeated twice). j Dot blot depicting Rap1a expression (log-transformed, normalized UMI counts) and percentage of cells positive for Rap1a in monocytes from mouse lung single-cell RNA-seq data following exposure to FA (n = 3) and CS for 2 (n = 5) and 4 months (n = 5). k mRNA expression levels of RAP1A determined by qPCR in the monocytes of smokers (n = 10) and non-smokers (n = 11) isolated from the peripheral blood. l MFI of ITGAL and ITGAM surface expression as determined by flow cytometry in Prmt7+/+ MH-S cells incubated with 20 μM GGTI (RAP1 inhibitor) for 2 h and analysed 6 h later (n = 2, repeated three times). m Western blot analysis of phosphorylated ERK in WT MH-S cells pretreated with the RAP1 inhibitor GGTI (20 μM) for 2 h and incubated for 15 min with 1 μg/ml LPS. Quantification relative to actin shown (repeated two times). Data shown mean ± SD, P values shown in charts determined by unpaired two-tailed Student’s t-test (b, h, k, l), one-way ANOVA Bonferroni’s multiple comparisons test (m). Source data are provided as a Source Data file.

