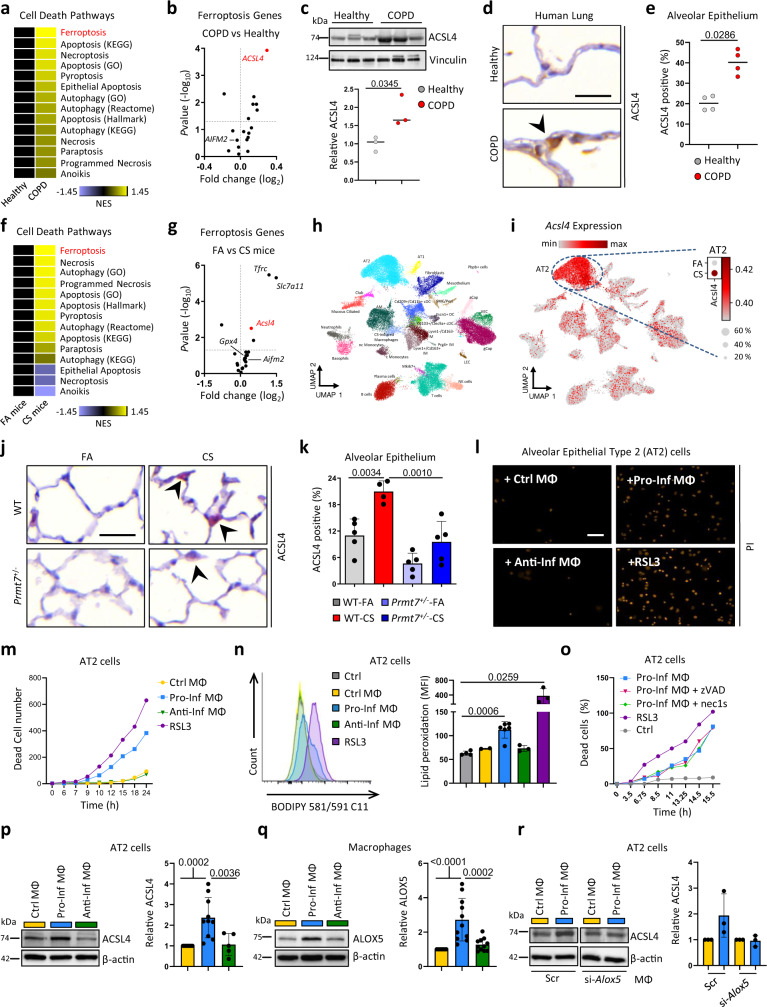
Fig. 5. Ferroptosis of lung alveolar epithelial cells in COPD induced by inflammatory macrophages.
a Heat map of normalized enrichment score (NES) following GSEA of cell death pathway gene lists on array data from lung tissue of COPD patients (GSE47460-GPL14550; 145 COPD patients vs 91 healthy controls). b Expression of ferroptotic genes in the lungs of COPD patients relative to healthy controls taken from GSE47460-GPL14550, relative fold change and P value calculated using the GEO2R interactive web tool running limma R. c Western blot analysis of ACSL4 expression in lung core biopsies from healthy (n = 3) and COPD patients (n = 3), quantification relative to vinculin shown for individual patients. d Representative images of immunohistochemical analysis for ACSL4 (brown signal indicated by arrowhead, hematoxylin counterstained, scale bar 25 μm) in lung sections from COPD patients (n = 4) and healthy controls (n = 4). e Quantification of alveolar epithelial cells positive for ACSL4. f Heat map of NES following GSEA of cell death pathway gene lists on array data from mice exposed to 4 m chronic cigarette smoke (CS, n = 3) v filtered air (FA, n = 3). g Expression of ferroptotic genes in the lungs of mice exposed to 4 m chronic CS (n = 3) relative to FA (n = 3) taken from array data used in (f), relative fold change and P value calculated using the GEO2R interactive web tool running limma R. h, i Cells from whole lung suspensions of mice exposed to FA (n = 3) or CS for 4 m (n = 5), were analysed by scRNA-Seq (Drop-Seq). h UMAP of scRNA-Seq profiles (dots) colored by cell type. i UMAP plots showing expression of ACSL4 in scRNA-Seq profiles. j Representative images of immunohistochemical analysis for ACSL4 (red signal indicated by arrowheads, hematoxylin counterstained, scale bar 25 μm) in lung sections from WT and Prmt7+/− mice exposed to FA or CS for 4 months (n = 4–5 per group). k Quantification of alveolar epithelial cells positive for ACSL4 from (j) (n = 5 for WT FA, Prmt7+/− FA, Prmt7+/− CS and n = 4 for WT CS). l, m Mouse AT2 cells (MLE12) were treated with RSL3 (250 nM), or conditioned medium from control macrophages (MФ, RAW264.7 cells) or those polarized to a pro-inflammatory (IFNγ + LPS) or anti-inflammatory (IL4) phenotype for 48 h, representative data shown from a single experiment repeated twice. l Representative image showing PI uptake at 24 h (Scale bar 50 µm). m Number of dead AT2 cells at the time indicated, data shown from a single experiment repeated twice. n BODIPY oxidation in AT2 cells (MLE12) at 6 h after treatment with RSL3 (250 nM, n = 3) or conditioned medium from control macrophages (n = 2) or those polarized to a pro-inflammatory (n = 6) or anti-inflammatory (n = 3) phenotype. o Number of dead AT2 cells (MLE12) by PI uptake at the time indicated following treatment with RSL3 (250 nM), or conditioned medium from macrophages (MФ, RAW264.7 cells) polarized to pro-inflammatory (IFNγ + LPS) plus 20 μM zVAD or 10 μM necrostatin-1s (Nec1-s), representative data shown from a single experiment repeated twice. p Western blot analysis of ACSL4 in AT2 cells (MLE12) treated for 24 h with conditioned medium from control macrophages (n = 11) or those polarized to a pro-inflammatory (n = 10) or anti-inflammatory (n = 5) phenotype, normalized to β-actin and shown relative to control macrophages. q Western blot analysis of ALOX5 at 72 h in control macrophages (n = 11) or those polarized to a pro-inflammatory (n = 11) or anti-inflammatory (n = 11) phenotype, normalized to β-actin and shown relative to control macrophages. r Western blot analysis of ACSL4 in AT2 cells (MLE12) treated for 24 h with conditioned medium from control macrophages or those polarized to a pro-inflammatory phenotype that were treated with siRNA against Alox5, normalized to β-actin and shown relative to control macrophages, from individual experiments (n = 3). Data shown mean ± SD, P values shown in charts determined by unpaired two-tailed Student’s t-test (c, n), two-tailed Mann–Whitney test (e), one-way ANOVA Bonferroni’s multiple comparisons test (k, p, q). Source data are provided as a Source Data file.

