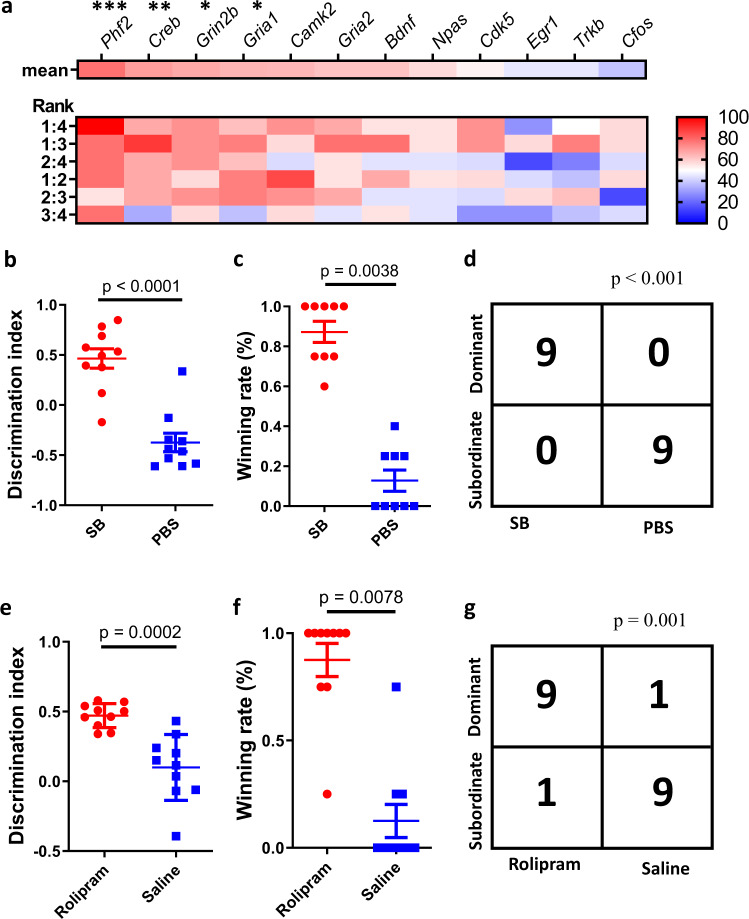
Fig. 4. Memory-improving drug-enhanced social dominance.
a The consistency between social rank and expression levels of memory-related genes in 6 pairwise comparisons. The value in the colored font indicates the percentage of higher-rank mice with a higher gene expression than lower-rank mice (binary rank-correlation test, n = 7–9 cages). b Discrimination index in the 1-hour NOR test between SB-treated mice and PBS-treated mice (unpaired t-test, n = 10 for each group). c Winning rate in the tube test between SB-treated mice and PBS-treated mice (Wilcoxon signed-rank test, n = 9 for each group). d The contingency table for the relationship between social dominance and SB treatment (Fisher’s exact test, n = 18). e Discrimination index in the 1-hour NOR test between rolipram-treated mice and saline-treated mice (unpaired t-test, n = 10 for each group). f Winning rate in the tube test between rolipram-treated mice and saline-treated mice (Wilcoxon signed-rank test, n = 10 for each group). g The contingency table for the relationship between social dominance and rolipram treatment (Fisher’s exact test, n = 20). Error bars = SEM.

