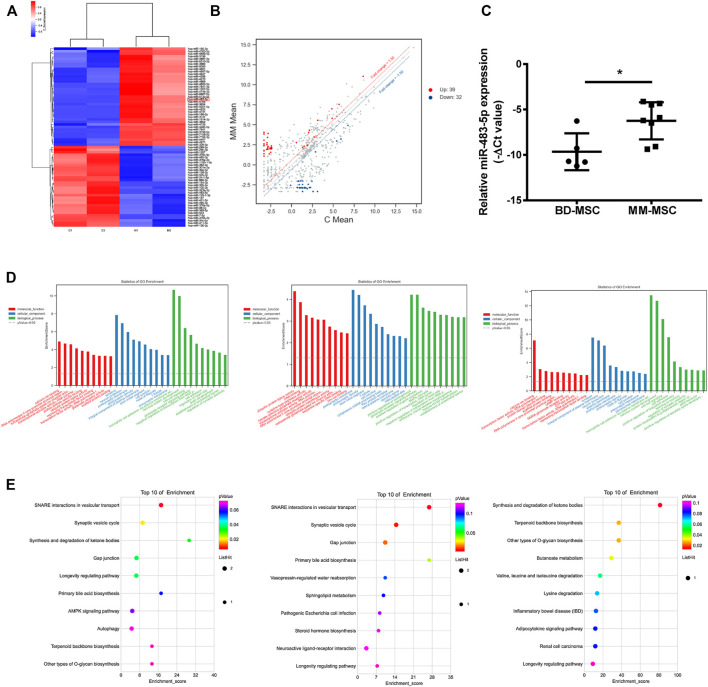
FIGURE 2.
Distinct gene expression profiling, network and functional enrichment analyses. (A) Cluster plots showed the expression of miRNAs in BMSCs from MM and BD patients. (B) Scatter plots showed gene expression changes in MM-MSCs and BD-MSCs. (C) miR-483-5p expression was validated by qRT-PCR. (D) GO enrichment analysis. (E) KEGG enrichment analysis.

