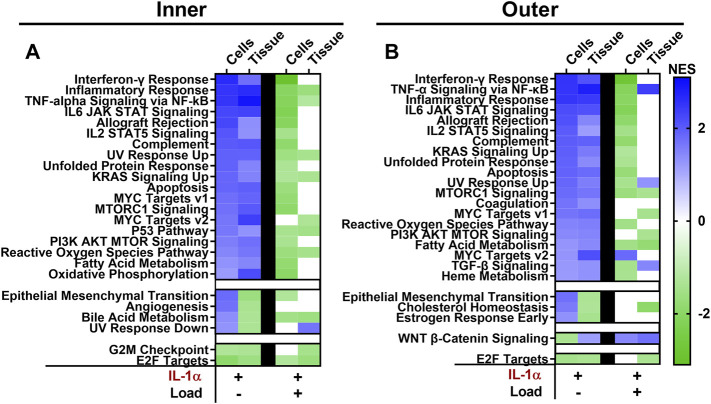
FIGURE 7.
The majority of pathways upregulated by IL-1α are downregulated by dynamic cell stretch in the presence of IL-1α. Pathways significantly differentially regulated with IL-1α stimulation are compared to significantly differentially regulated pathways with dynamic loading in the presence of IL-1α for inner (A) and outer (B) zones. Cell stretch and tissue compression normalized enrichment scores (NES) are shown in each column. A NES > 0 identifies upregulated (blue) pathways and a NES < 0 identifies downregulated (green) pathways. White boxes denote that the geneset did not meet the cutoff for significance (FDR < 0.25).

