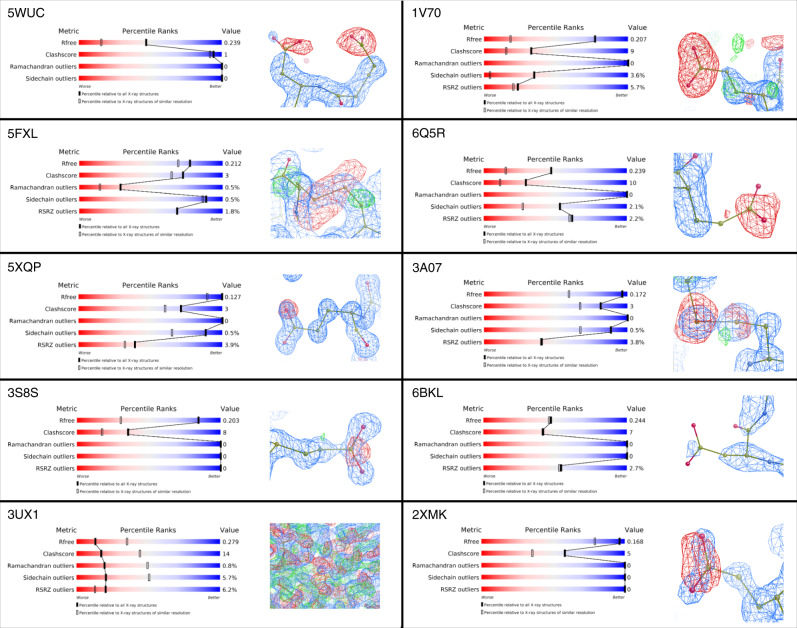
Fig. 6. Observation of typical radiation damage features in structures with high Bnet values.
wwPDB validation statistics, models and density maps for the ten structures with the highest Bnet values in the PDB-REDO databank. For the eight structures with visible radiation damage artefacts in their associated electron density difference maps, a representative example is shown: for the two structures without such artefacts, the alternative causes of their high Bnet and Bnet-percentile values are shown instead. 2mFobs – DFcalc maps (blue) are contoured at 1.5 rmsd; Fobs – Fcalc difference density maps are contoured at ± 3.0 rmsd (green/red).

