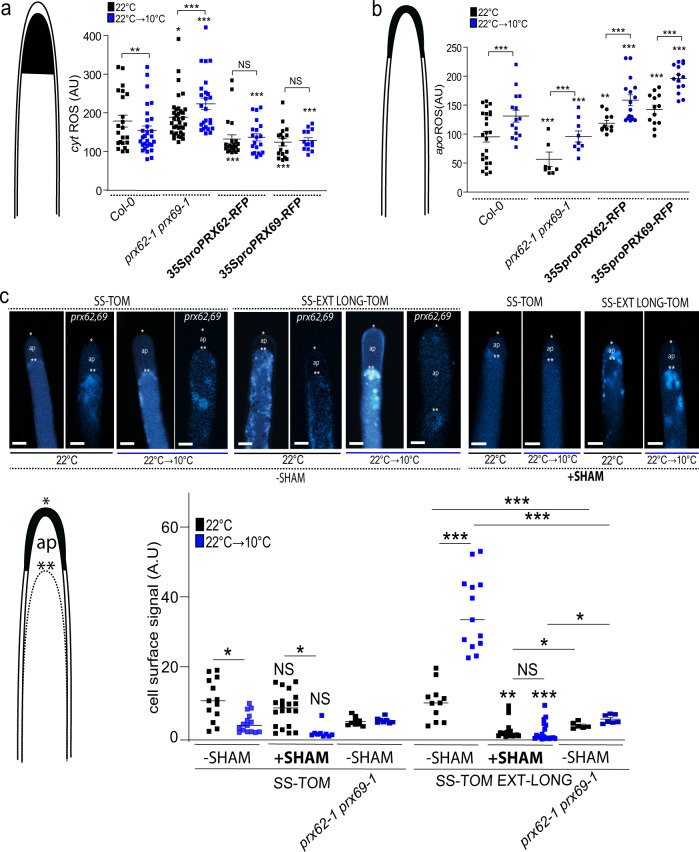
Fig. 5. ROS-homeostasis and EXT-stabilization in RH apical cell wall depend on PRX62 and PRX69 proteins.
a Cytoplasmic ROS (cytROS) levels were measured using 2′,7′-dichlorodihydrofluorescein diacetate (H2DCF-DA) in apical areas of RHs in wild-type (Columbia Col-0), in the double mutant prx62-1 prx69-1 and in the 35SproPRX62-tagRFP/Col-0 and 35SproPRX69-tagRFP/Col-0 lines grown at 22 °C or 10 °C. Each point is the signal derived from a single RH tip. Fluorescence AU data are the mean ± SD (N = 18 root hairs), two-way ANOVA followed by a Tukey–Kramer test; (**) p < 0.01 (***) p < 0.001. Results are representative of two independent experiments. Asterisks indicate significant differences. NS = non-significant differences. Exact p-values are provided in the Source Data file. b Apoplastic ROS (apoROS) levels were measured with Amplex™ UltraRed in apical areas of RHs in wild-type (Columbia Col-0), in the double mutant prx62-1 prx69-1 and in the 35SproPRX62-tagRFP/Col-0 and 35SproPRX69-tagRFP/Col-0 lines grown at 22 °C or 10 °C. Each point is the signal derived from a single RH tip. Fluorescence AU data are the mean ± SD (N = 11 root hairs), two-way ANOVA followed by a Tukey–Kramer test; (***) p < 0.001. Results are representative of two independent experiments. Asterisks indicate significant differences. Exact p-values are provided in the Source Data file. c Signal of SS-TOM and SS-EXT LONG-TOM in the apical zone of RHs grown at 22 °C or 10 °C with or without SHAM treatment in Col-0 and in the prx62-1 prx69-1 double mutant without SHAM. Cells were plasmolyzed with a mannitol 8% solution. In the images: (*) indicates cell surface including the plant cell walls, (**) indicates the retraction of the plasma membrane, (ap) apoplastic space delimitated between the plant cell wall and the retracted plasma membrane. Each point is the signal derived from a single RH tip. Fluorescence AU data are the mean ± SD SD (N = 11 root hairs), two-way ANOVA followed by a Tukey–Kramer test; (*) p < 0.05, (**) p < 0.01, (***) p < 0.001. Results are representative of two independent experiments. Asterisks on the graph indicate significant differences between each genotype 22 °C vs 10 °C. NS = non-significant differences. Exact p-values are provided in the Source Data file. Scale bars = 5 µm.

