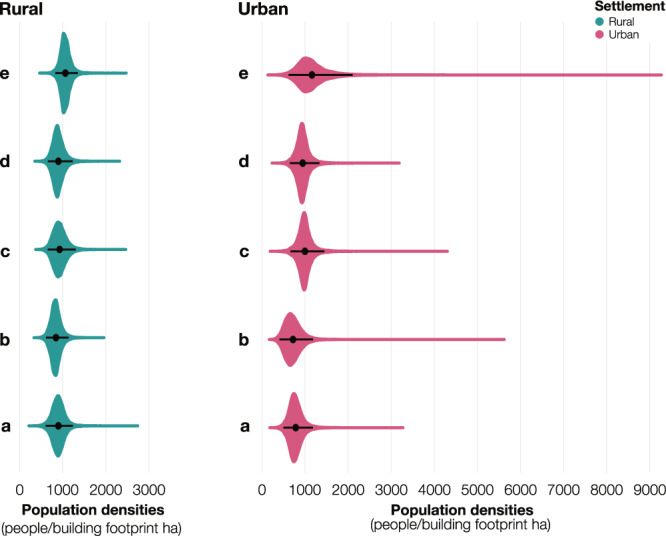
Fig. 3. Model intercepts.

Posterior probability distributions of the random intercepts (people/building footprint ha) by settlement type (urban in pink and rural cluster in turquoise) across the provinces of (a) Kinshasa, (b) Kongo Central, (c) Kwango, (d) Kwilu, and (e) Mai-Ndombe. The black dots show the mean of the distributions and the horizontal black lines show the 95% credible intervals derived from the posterior distribution (n = 10,000). Source data are provided with this paper.
