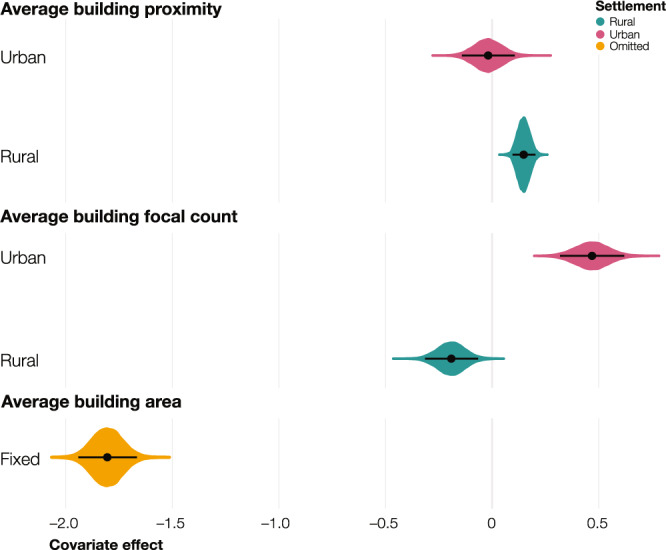
Fig. 4. Covariates effect.

Posterior probability distribution of the random effect by settlement type (urban in pink and rural in purple) for the covariates average building proximity and average building focal count and the fixed effect (in orange) for the covariate average building area. The black dots show the mean of the distributions and the horizontal black lines show the 95% credible intervals derived from the posterior distribution (n = 10,000). Source data are provided with this paper.
