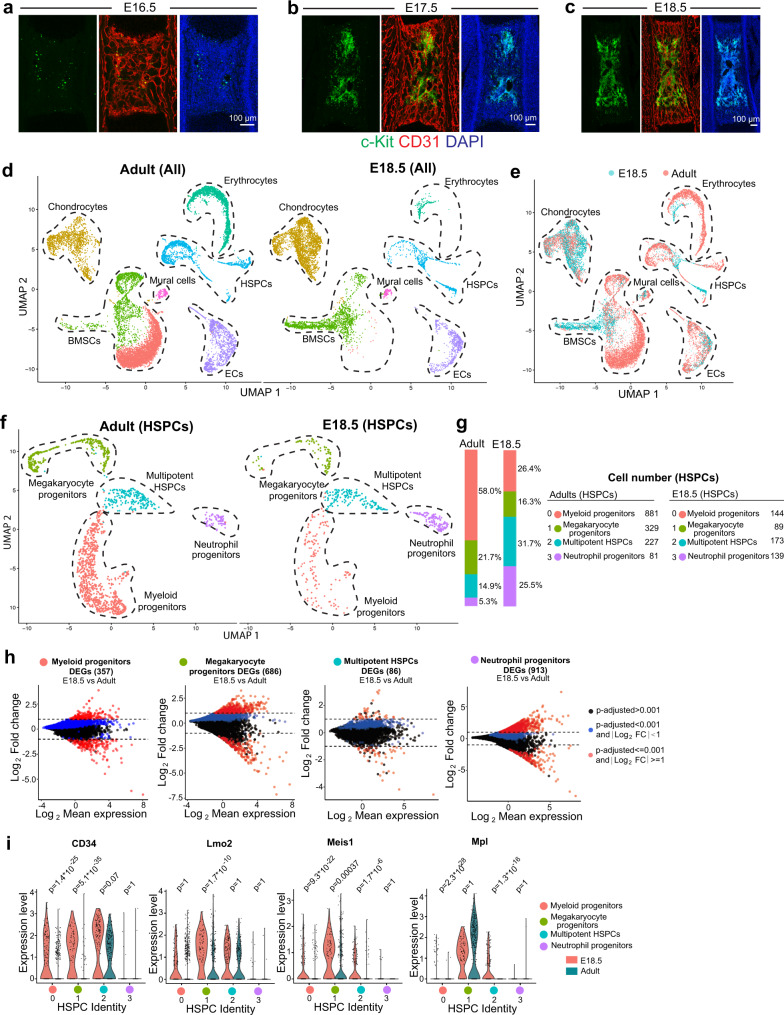
Fig. 1. Comparative analysis of embryonic and adult BM components.
a–c Representative overview images showing c-Kit+ (green) cells in femoral BM at E16.5 (a), E17.5 (b) and E18.5 (c). CD31(Red); Nuclei, DAPI (blue). d, e UMAP plots showing unsupervised clustering of BM cells from E18.5 and adult femur after depletion of Lin+ cells (d) and the differences between the sample groups (e). f UMAP plot showing unsupervised subclustering of E18.5 and adult haematopoietic stem and progenitor cells (HSPCs). g Bar chart indicating percentage of cells in each subcluster. Cell numbers are shown on the right. h Differentially expressed genes (DEGs) comparing each subcluster of HSPC between E18.5 and adult. Blue dots, p-adjusted value < 0.001; Red dots, p-adjusted value < 0.001 and Log2 fold change >1. Two-tailed Student’s t test. i Violin plots showing the expression of selected genes with log normalized values (y axis) for critical transcription factors and receptors in each subcluster of E18.5 and adult HSPCs.

