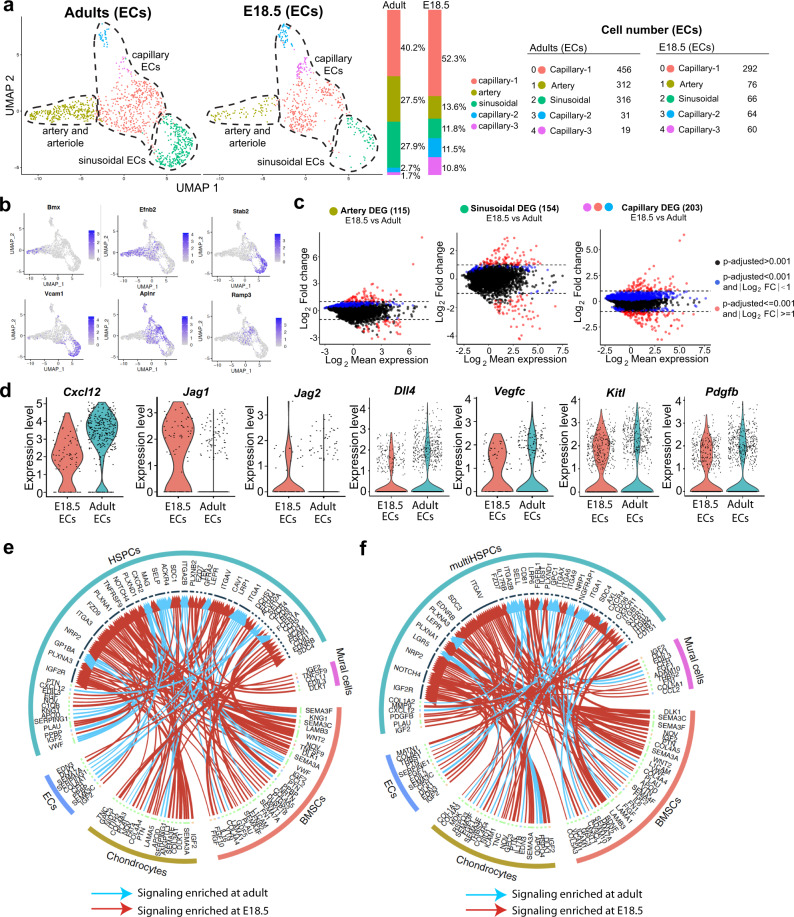
Fig. 3. Comparative analysis of embryonic and adult endothelial cells.
a UMAP plot showing unsupervised subclustering of E18.5 and adult femoral ECs. Bar charts indicate percentage of each subcluster. Cell numbers are shown on the right. b UMAP plots showing distribution of representative markers for each EC subcluster. Color represents relative gene expression level. c DEGs for E18.5 and adult EC subclusters. Blue dots, p-adjusted value < 0.001; Red dots, p-adjusted value < 0.001 and Log2 fold change >1. Two-tailed Student’s t test. d Violin plots showing expression of selected EC-derived HSPC-supporting factors at E18.5 or in adult with log normalized values (y axis). e, f Interactome analysis of potential interactions (arrows) between non-haematopoietic supportive cells and HSPCs (e) or multipotent HSPCs (f). Width of line and arrow represent relative log2 fold change of genes. Cyan arrows indicate signaling enriched in adult; red arrows show enrichment at E18.5.

