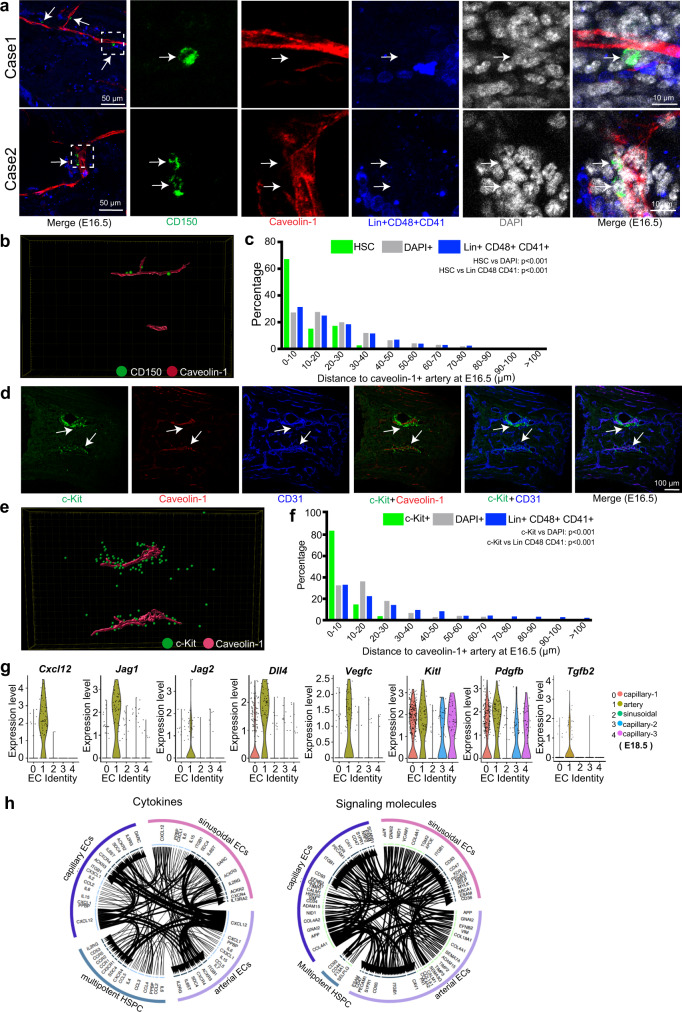
Fig. 4. Arteries are linked to initial HSC and HSPC engraftment in fetal BM.
a Overview and high-magnification representative images showing close alignment of Lin− CD48− CD41− CD150 + HSC (green, arrows) and Caveolin-1+ AECs (red) at E16.5. Blue, Lin+ CD48+ CD41+. White box in left panel indicates position of high magnification images. b 3D-reconstructed image showing CD150+ cells (green) and Caveolin-1+ arteries (red). c 3D-reconstruction-based quantification of distance between HSCs (N = 48), Lin+ CD48+ CD41+ mature haematopoietic cells (N = 2203) or DAPI+ random cells (N = 6174) and Caveolin-1+ AECs at E16.5. P-value, Kolmogorov-Smirnov test. d Representative images showing close alignment of c-Kit+ haematopoietic cells (green) and Caveolin-1+ AECs (arrows, red) at E16.5. CD31, blue. e Representative 3D-reconstructed image showing location of c-Kit+ haematopoietic cells (green) and Caveolin-1 (red). f 3D-reconstruction-based quantification of distance between c-Kit+ (N = 258), Lin+ CD48+ CD41+ mature haematopoietic cells (N = 2052) or DAPI+ random cells (N = 6665) and Caveolin-1+ AECs at E16.5. P-value, Kolmogorov-Smirnov test. g Violin plots showing expression of selected genes encoding angiocrine or HSPC-supportive factors in AECs or other EC subclusters at E18.5 with log normalized values (y axis). h Interactome analysis of potential interactions (arrows) between multipotent HSPCs and different ECs subclusters. Width of line and arrow represent relative expression level of genes.

