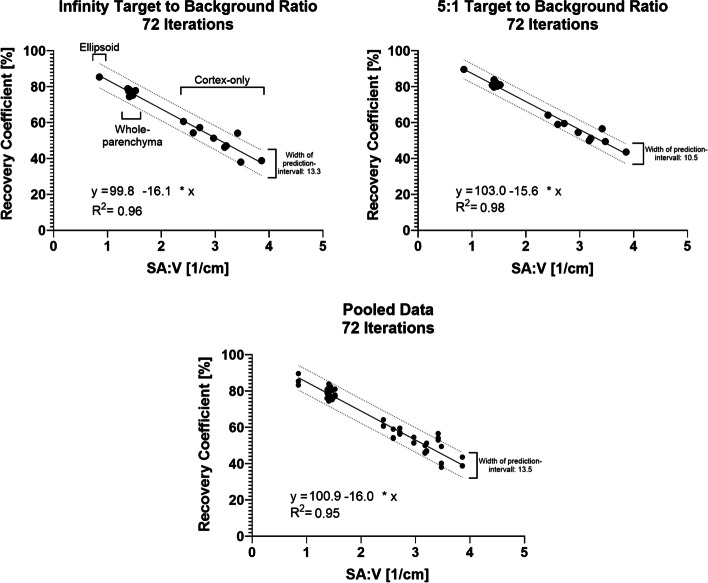
Fig. 5.
Correlation of recovery coefficients and surface-area-to-volume ratio. Recovery coefficients vs. surface-area-to-volume (SA:V) ratios for all phantoms in the study. The infinity (cold background) (top left graph), 5:1 target-to-background ratios (top right), and the pooled data (bottom, infinity, 5:1 and 10:1 TBR) are shown with 72 iterations. Additionally, the best fit (solid line), the 95% prediction intervals (dashed lines) of the linear regression analysis, the average width of the prediction intervals, the equation of the best fit, and the goodness of fit (given as R-squared) are provided. The additional labels in the top left image indicate the position of the phantom type (ellipsoid. whole-parenchyma, cortex-only) in the graph. Values were obtained for LEHR collimation and the radionuclide 99mTc

