Fig. 2.
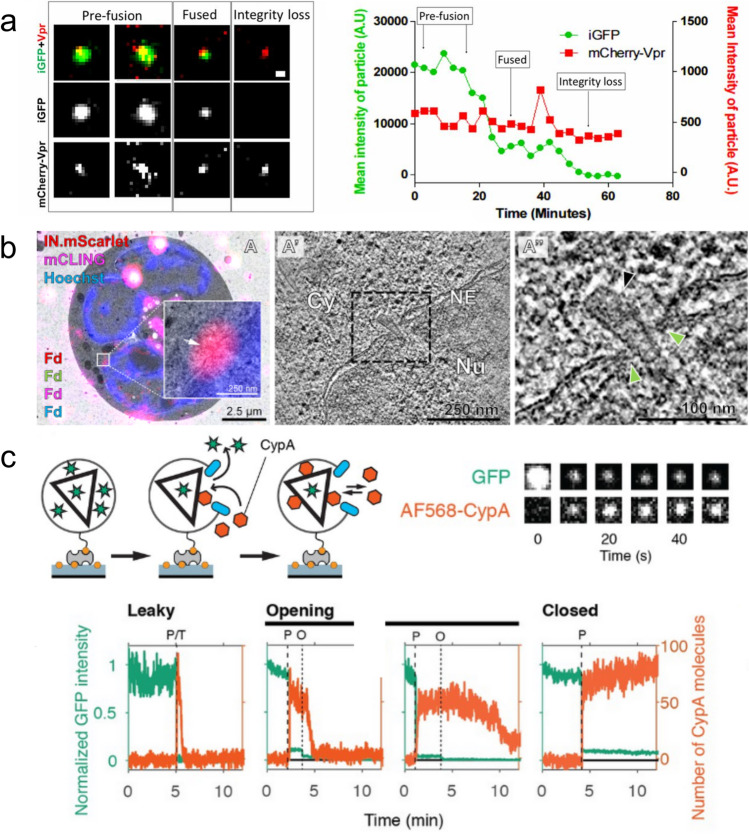
Selection of imaging methods for visualising uncoating at the level of individual cores. (a) Live-cell imaging of HIV iGFP/mCherry-Vpr particles. Two independent GFP signal drops are detected, with the first indicative of membrane fusion and the second indicative of capsid integrity loss. mCherry-Vpr is used to track the particles. The graph plots mean signal intensities of GFP (green) and mCherry-Vpr (red) over time. (Reproduced from Mamede et al. 2017.) (b) Correlative light and electron microscopy. (A) Overlay of a fluorescence image with the relevant electron micrograph, exhibiting an IN-mScarlet positive and mCLING-negative foci at the nuclear envelope. (A′, A″) A slice through a tomographic reconstruction of the position captured in (A), highlighting an intact capsid (indicated by the black arrowhead) deep inside the NPC (indicated by green arrowheads) with its narrow end pointed towards the nucleoplasm. (Reproduced from Zila et al. 2021.) (c) A schematic diagram of the TIRF assay, showing both GFP contained within the capsid to track capsid integrity and the binding of AF568-CypA to visualise capsid behaviour after membrane permeabilisation. Also included are snapshots of the GFP and AF568-CypA signal of a selected single viral particle at different time points. Example traces show leaky, opening, and closed traces, with green and orange used to indicate the GFP and CypA signals respectively. Capsid lifespan is indicated by loss of GFP signal and demarcated by the dotted lines. (Reproduced from Márquez et al. 2018)

