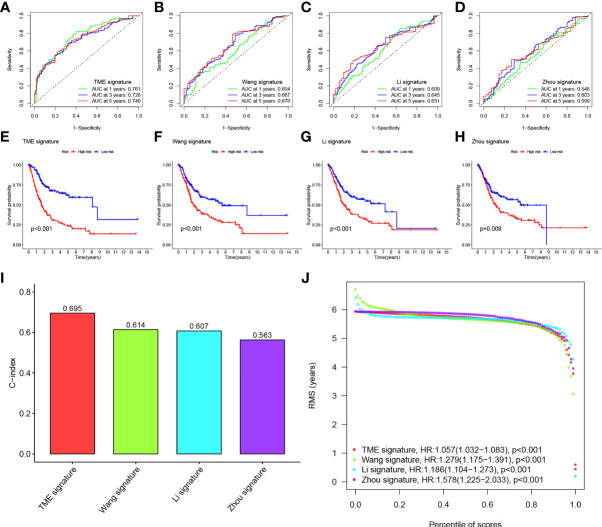
Figure 6.
(A–D) ROC of three other published gene signatures. (E–H) KM curves of three other published gene signatures. (I) Concordance index (C-index) of the four prognostic risk models including our model, which has the highest C-index. (J) Restricted mean survival (RMS) time curve of all five prognostic risk models, revealing an overlap of 60 months.

