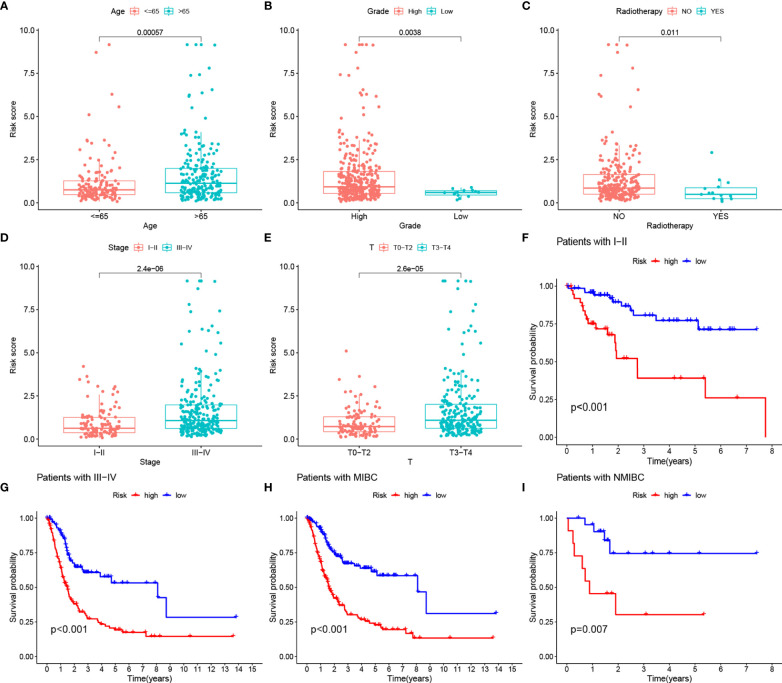
Figure 8.
(A–E) RS comparison of clinical information of BLCA samples. (F, G) Evaluation of the eight-gene risk model in different stage groups with OS KM curves comparing HRG and LRG. (H, I) Evaluation of the eight-gene risk model in different degree of tumor infiltration groups with OS KM curves comparing HRG and LRG.

