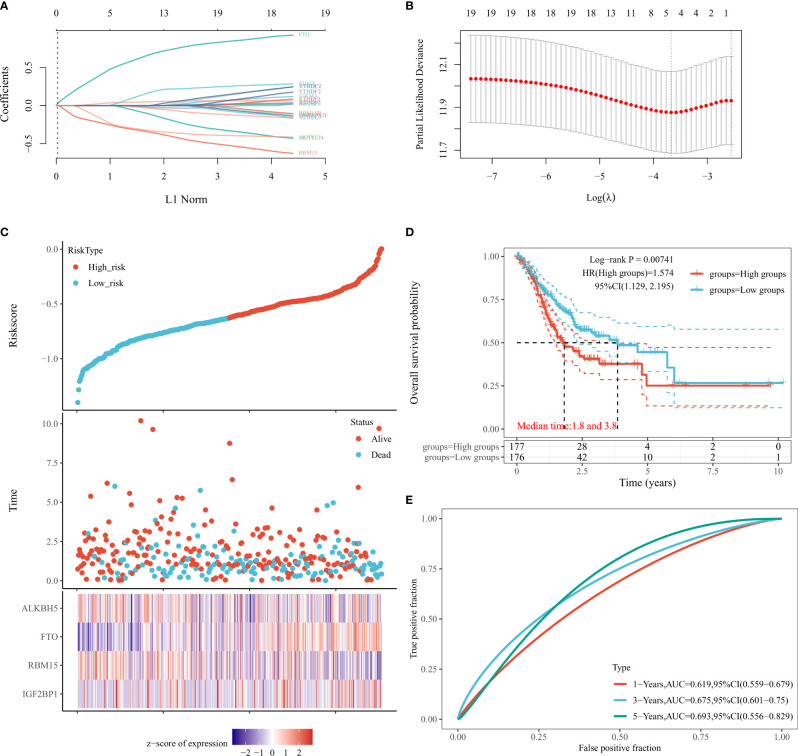
Figure 4.
Relationship between m6A RNA methylation regulators and prognosis of STAD patients by constructing LASSO models in TCGA database. (A, B) Relationship between the solution path of LASSO model and cross-validation mean square error (CV MSE) and model size. (C) Risk assessment subgroups of STAD patients and the expression levels of IGF2BP1, RBM15, FTO, and ALKBH5 within the subgroups. (D) Kaplan-Meier curves of STAD patients in the high-risk and low-risk groups according to risk scores. (E) ROC curves to validate the LASSO model for 1-, 3-, and 5-year prediction efficiency.

