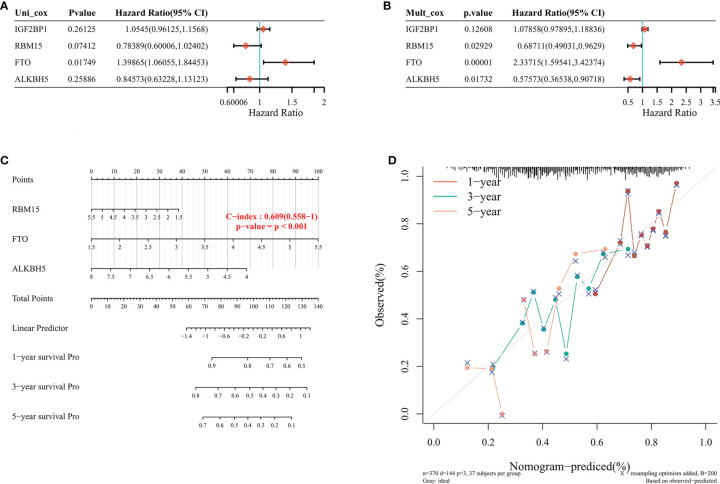
Figure 5.
Nomogram plot construction in TCGA database. (A, B) Univariate and multifactorial cox analysis of p-value, risk factor HR, and confidence interval for 4-m6A RNA methylation regulator expression and clinical characteristics. (C) Columnar plots to predict 1-year, 3-year, and 5-year overall survival of STAD patients (D) Calibration curves of the overall survival line plot model in the discovery group. The diagonal dashed line indicates the ideal column line plot, the blue, red, and orange lines indicate the observed 1-year, 3-year, and 5-year column line plots.

