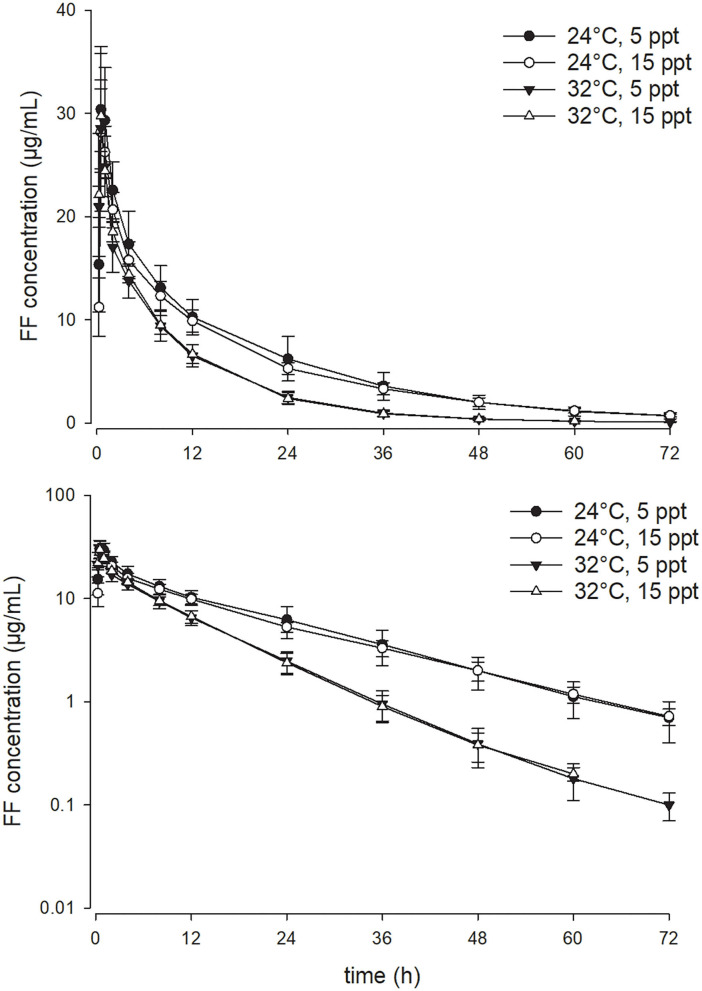
Figure 2.
Linear (above) and semi-logarithmic plots (below) of the complete serum concentration-time profile from 0 to 72 h (mean ± SD) of 15 mg/kg florfenicol following oral (PO) administration at two temperatures and two salinities (n = 4 for the 32°C with 15 ppt group; n = 7 for the other three groups).

