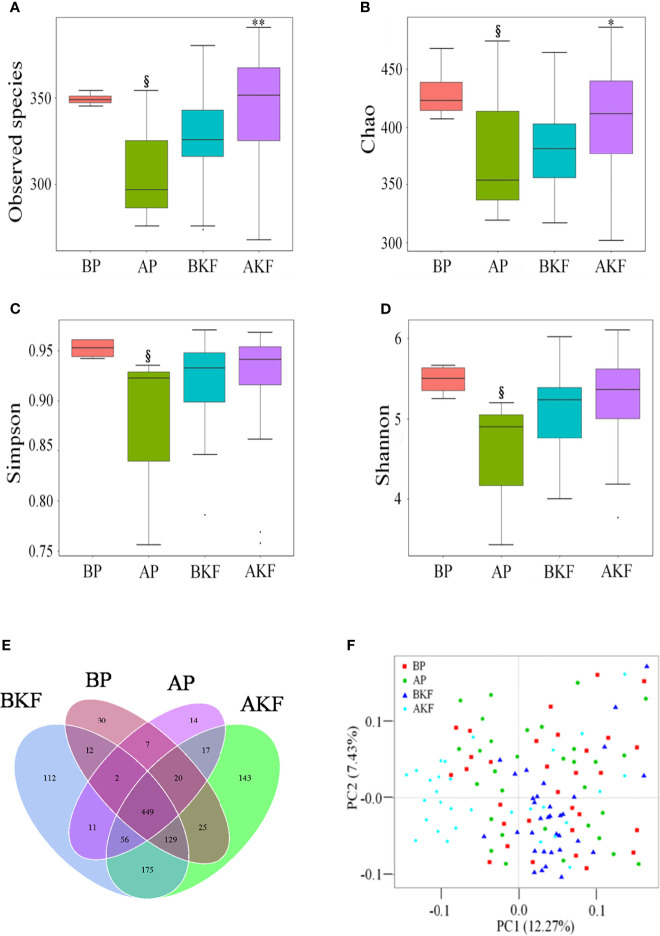
Figure 2.
KF treatment on gut microbiota richness and diversity. (A–D) α-diversity of the intestinal microbiota was measured by observed species (A), Chao 1 index (B), inverse Simpson index (C), and Shannon index (D). Venn diagram illustrated overlap of OTUs in the gut microbiota among the samples (E). (F) β-diversity demonstrated that samples after treatment tender to cluster together and away from the samples before treatment. § p <0.05 versus BP and *p <0.05, ** p <0.01 versus BKF. BP, before placebo; AP, after placebo; BKF, before konjaku flour; AKF, after konjaku flour.

