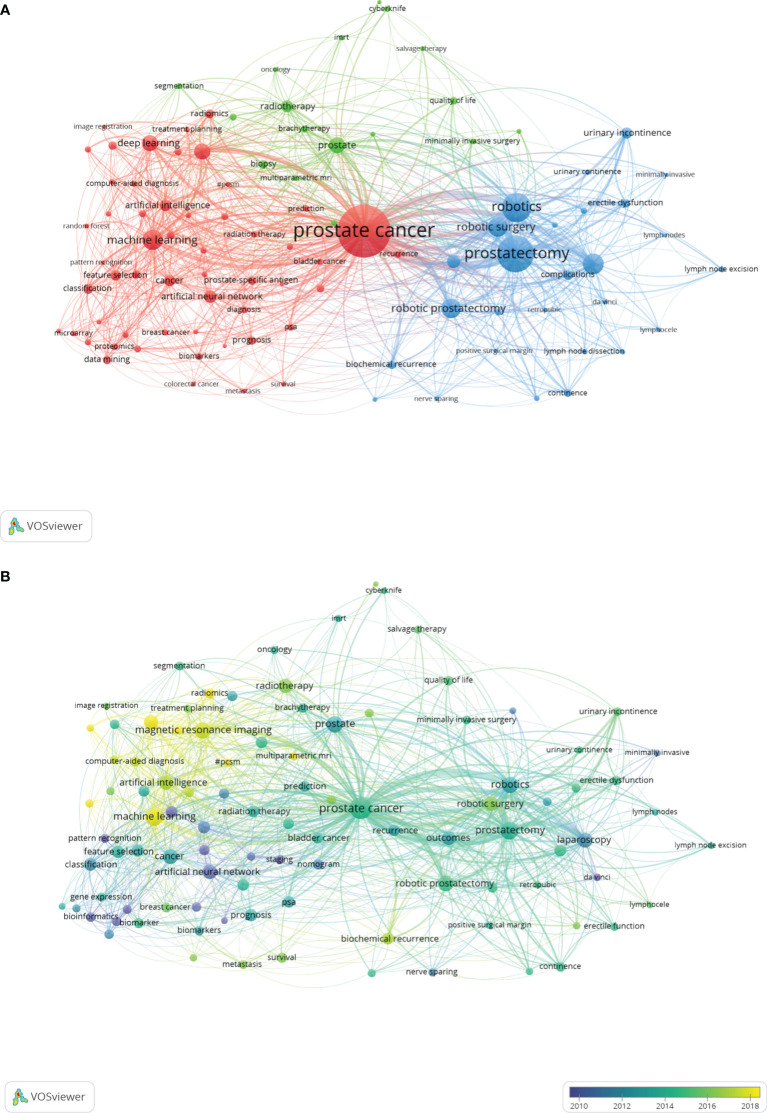
Figure 9.
The network visualization map of the 98 keywords with a frequency of no less than 10 times generated by using VOSviewer. (A) All the keywords could be clustered into 3 clusters: #Cluster 1 (Diagnosis and Prediction AI-related study, red nodes), #Cluster 2 (Non-Surgery AI-related study, green nodes), and #Cluster 3 (Surgery AI-related study, blue nodes). (B) The overlay visualization map of keywords. The purple and blue nodes represent the keywords appearing earlier than the green and yellow nodes.

