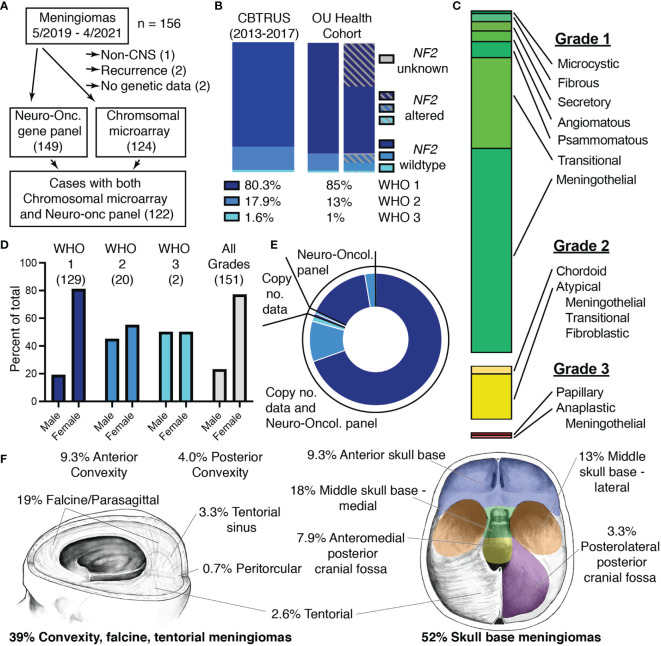
Figure 1.
Characteristics of the two-year OU Health meningioma cohort. (A) Flowchart depicting selection of meningiomas for the OU Health cohort and molecular data collected with the number of cases shown in parentheses. (B) Percentages and NF2-status of meningiomas assigned to each WHO grade in the meningioma cohort with national data from the 2020 CBTRUS statistical report shown for reference (2). (C) Histologic architecture seen in the meningioma cohort. Proportions of Grade I (green), Grade II (yellow), and Grade III (red) meningiomas are shown. (D) Proportion of male and female patients for each WHO Grade and the total cohort. The number of patients in each category is shown in parentheses. (E) Plot depicting the proportion of cases with data from either the Neuro-Oncology Panel, copy number data (chromosomal microarray), or cases with Neuro-Oncology Panel as well as copy number data. Shades of blue correspond to WHO Grade I-III as in panel (B). (F) Location of meningiomas included in the cohort. Meningiomas classified as spinal (2.6%), optic nerve (0.7%), and cases with multiple meningiomas (6%) are not shown.

