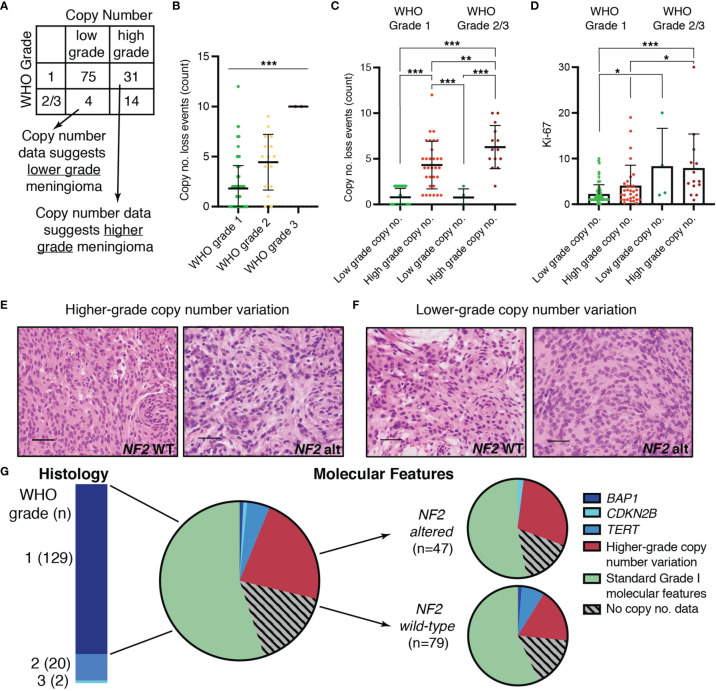
Figure 2.
Cases with inconsistencies between molecular data and histopathologic WHO grading. (A) Comparison of “molecular grade” suggested by copy number data with histopathologic WHO grade. (B) Absolute count of chromosome arms with copy number loss events in any of: 1p, 3p, 4p/q, 6p/q, 10 p/q, 14q, 18p/q, 19p/q, 22 p/q in each WHO grade. (C) Absolute count of copy number loss events for cases with low-grade or high-grade copy number profiles in WHO grade 1 and WHO grade 2/3 meningiomas. (D) Scatter plot showing maximum Ki-67 for WHO grade 1 and WHO grade 2/3 meningiomas with low-grade or high-grade copy number profiles. (E, F) Representative images showing hematoxylin and eosin (H&E)-stained slides at 40X demonstrating the histomorphology of NF2 wild-type (left) and NF2 altered (right) meningiomas with (E) higher-grade or (F) lower-grade copy number profiles. (G) Pie chart depicting the proportion of WHO grade 1 cases with higher-grade copy number profiles or with sequence alterations in BAP1, CDKN2B, or TERT in the total cohort (middle) and in NF2 wild-type versus NF2 altered meningiomas (right). Mutations in the TERT promoter were seen 17% (1/6) of the TERT alterations. For panels (B–D), mean and standard deviation is shown and statistical significance is indicated by asterisks (*p < 0.05, **p < 0.01, ***p < 0.001).

