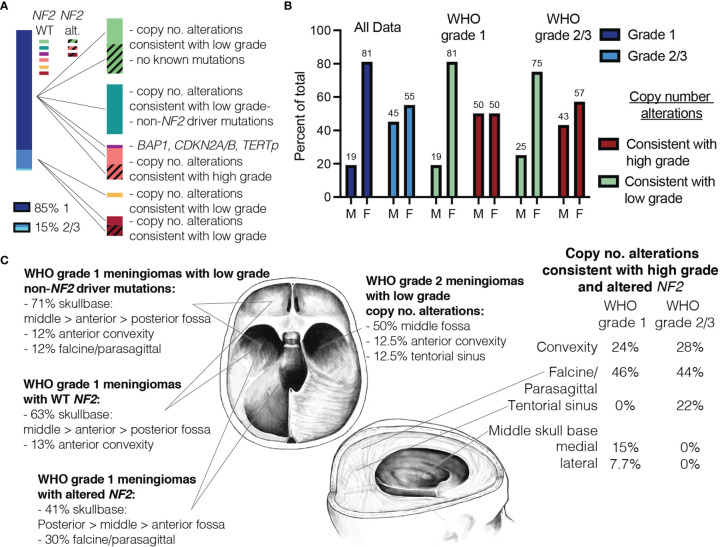
Figure 4.
Similarities in demographics and tumor location are seen in meningiomas with similar copy number data. (A) Proportion of grade 1 vs. grade 2/3 meningiomas based on histopathologic grading shown on left. Meningiomas divided by molecular data (right). (B) Male-to-female ratio plotted side by side for all WHO grade 1 and grade 2/3 meningiomas (blue), meningiomas with copy number alterations consistent with low grade (green) and those consistent with high grade (red). (C) Meningiomas with low grade copy number alterations predominately occur in skull base locations (WHO grade 1 meningiomas shown on left). WHO grade 2 meningiomas with low grade copy no. alterations and meningiomas with high grade copy no. alterations are shown on right.

