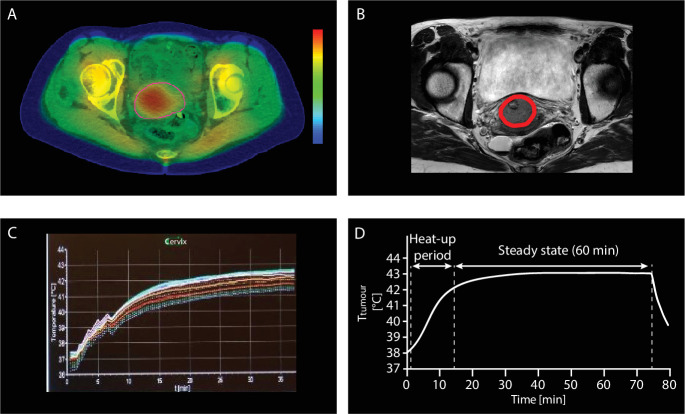
Figure 2.
Hyperthermia treatment planning and temperature during treatment. (A) Hyperthermia treatment planning with the cervical tumor contoured in red on a dedicated hyperthermia CT scan with thermal probes in situ made directly before hyperthermia treatment. Also shown are the hot (red area) and cold (green area) spots. (B) MRI scan as help for appropriate contouring of the tumor on CT. (C) Real tumor temperature profile containing temperature readings of target area and surrounding areas during treatment. (D) Simplified tumor temperature profile during treatment.

