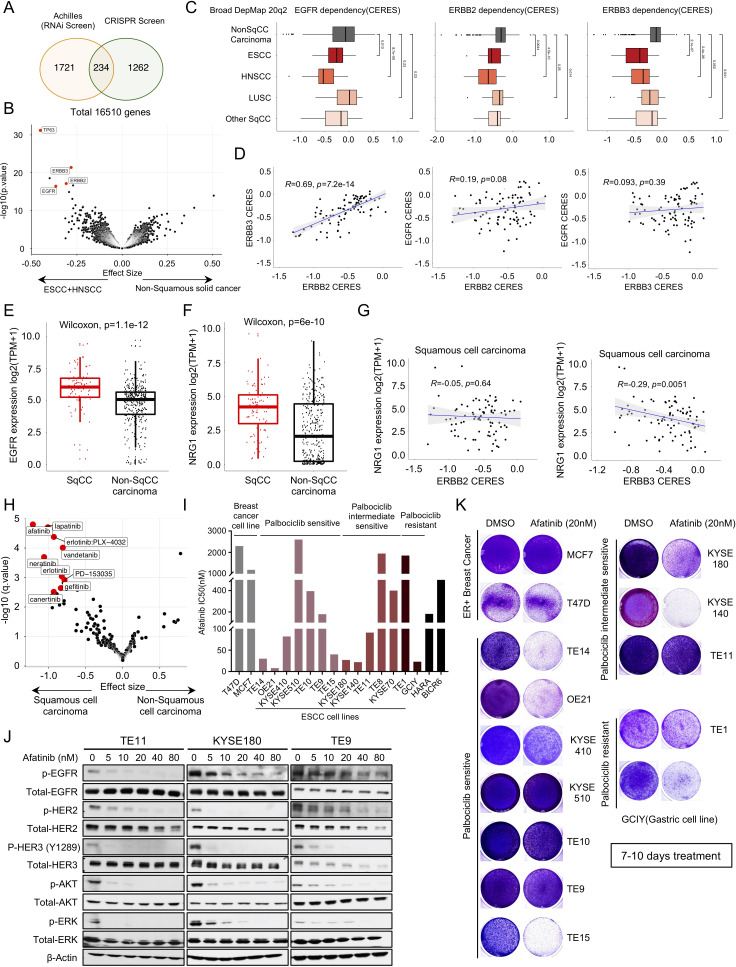
Figure 2.
ERBB family of kinases emerge as strong dependencies across OSCC. (A) Venn diagram showing the overlap of genes that are significantly more essential in OSCC and HNSCC cell lines than other non-squamous solid tumour cell lines from Broad Institute Achilles RNAi screen and Broad Institute Achilles CRISPR screen datasets. (B) Broad Institute Achilles CRISPR screen data (DepMap 20q2 public) analysis showing selective dependency genes in OSCC and HNSCC versus non-squamous carcinoma cell lines, as illustrated in volcano plot. Each dot represents a gene, and the effect size explains the mean difference of gene dependency score between the two groups. (C) The dependency score (CERES) of EGFR, ERBB2 and ERBB3 in different squamous cell carcinomas subtypes and non-squamous carcinoma cells. Wilcoxon test was performed to compare CERES values in two groups. (D) Pearson correlation of EGFR, ERBB2 and ERBB3 gene dependency score in squamous cell carcinoma cell lines based on Broad Institute Achilles CRISPR screen data (DepMap 20Q2 public). (E) mRNA expression of EGFR in squamous carcinoma cell lines and non-squamous carcinoma cell lines based on Broad Institute Cancer Cell Line Encyclopedia data (DepMap 20Q2 public). Wilcoxon test was performed for two group comparison. (F) mRNA expression of NRG1 in squamous carcinoma cell lines and non-squamous carcinoma cell lines based on Broad Institute Cancer Cell Line Encyclopedia data (DepMap 20Q2 public). Wilcoxon test was performed for two group comparison. (G) Pearson correlation of NRG1 expression and ERBB2 (left) or ERBB3 (right) gene dependency score in squamous cell carcinoma cell lines. (H) CTRP CTD2drug sensitivity area under the curve (AUC) data mining showing selective drug sensitivity in genes in squamous carcinoma cell lines and non-squamous carcinoma cell lines. Each dot represents a drug, and the effect size explains the mean difference of drug sensitivity AUC between the two groups. (I) Afatinib drug sensitivity half maximal inhibitory concentration (IC50) values (nM). Cell lines are colour coded as shown in figure 1B. (J) Immunoblot analysis of genes involved in ERBBs and downstream pathway in TE9, TE11 and KYSE180 cells treated with afatinib (5 nM, 10 nM, 20 nM, 40 nM and 80 nM) or with DMSO control. Protein lysates were collected after drug treatment for 24 hours. Immunoblots from one representative experiment (n=2) are shown. (K) Images showing crystal violet staining of cell lines are listed in figure 2I, after 20 nM afatinib treatment for 7–10 days. Data from one representative experiment are presented (n=3). OSCC, oesophageal squamous cell carcinoma.

