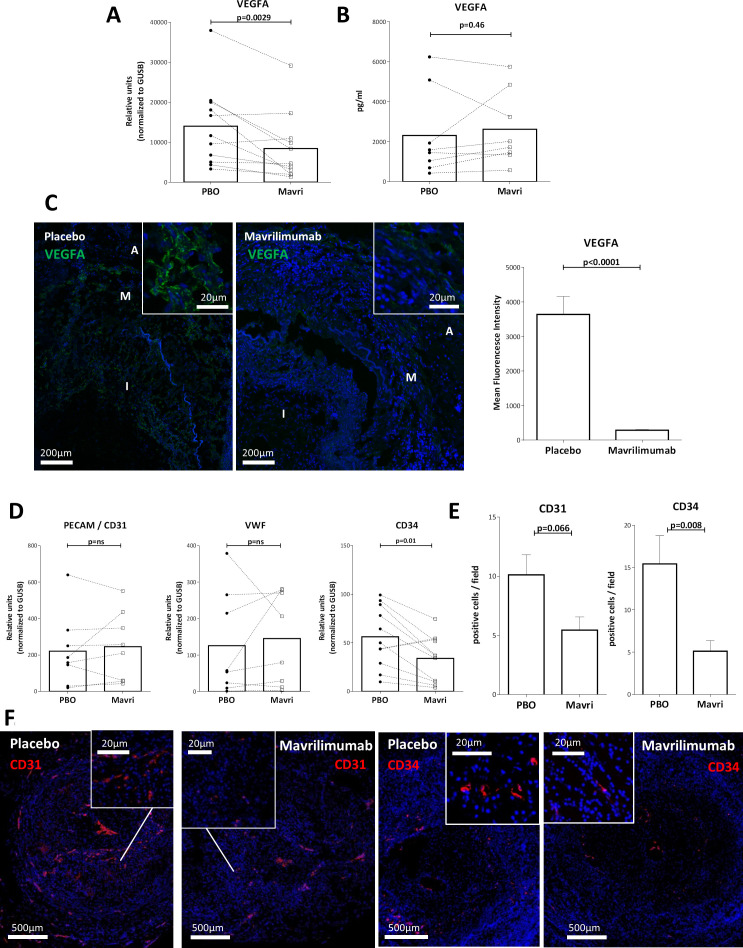
Figure 8.
Mavrilimumab effect on angiogenesis. (A) Detection of vascular endothelial growth factor A (VEGFA) transcripts in 11 GCA-positive temporal arteries cultured with placebo or mavrilimumab. (B) Detection of VEGFA protein (pg/mL) in supernatants of eight respective arteries cultured with placebo or mavrilimumab. (C) Immunofluorescence with anti-VEGFA antibody of a GCA artery cultured with placebo or mavrilimumab (I, intima; M, media; A, adventitia). The graph on the right shows quantification of mean fluorescence intensity of the entire artery wall. (D) Measurement of PECAM-1 (n=8), vWF (n=8) and CD34 (n=11) transcripts in GCA cultured temporal arteries treated with placebo or mavrilimumab (relative units, normalised to housekeeping GUSB). (E) Quantification (positive cells per field) of immunofluorescence. Immunofluorescence was performed on two cultured biopsies with consistent results. (F) Immunofluorescence with anti-CD31 or anti-CD34 antibody of a GCA artery cultured with placebo or mavrilimumab. Inset images show zoom amplifications of positive (red) cells in areas of interest across the neointimal layer. Panel E is the quantification of panel F. GCA, giant cell arteritis.

