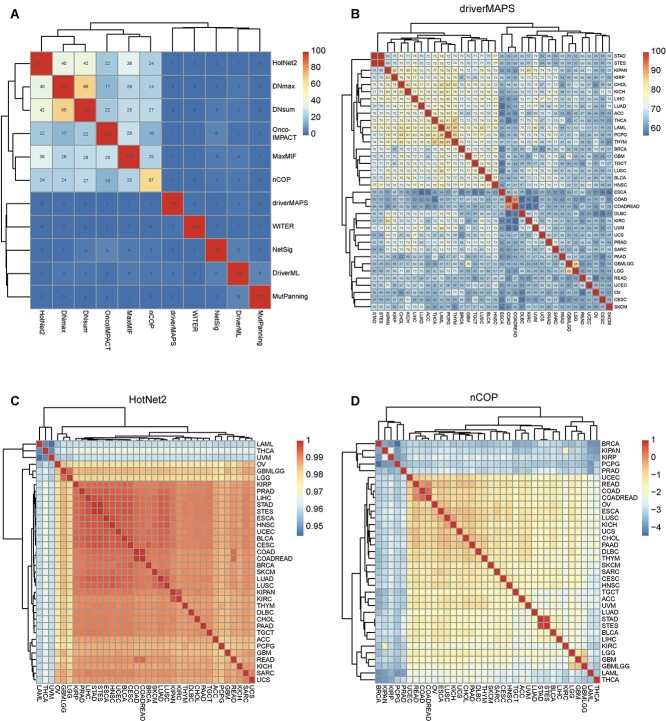
Figure 6.
Similarities among different computational methods and cancer types measured by candidate driver genes. Pairwise intersections of top 100 predictor driver genes among 11 computational methods based on pan-cancer analysis are shown in (A). Pairwise intersections of top 100 predictions using driverMAPS among 36 cancer types are shown in (B). The numbers in the grid represent the number of candidate driver genes shared by any two types of methods (A) or any two types of cancers (B). One minus Euclidean distance of top 100 predictions in HotNet2 (C) and nCOP (D) among 36 cancer types are shown in (C) and (D).

