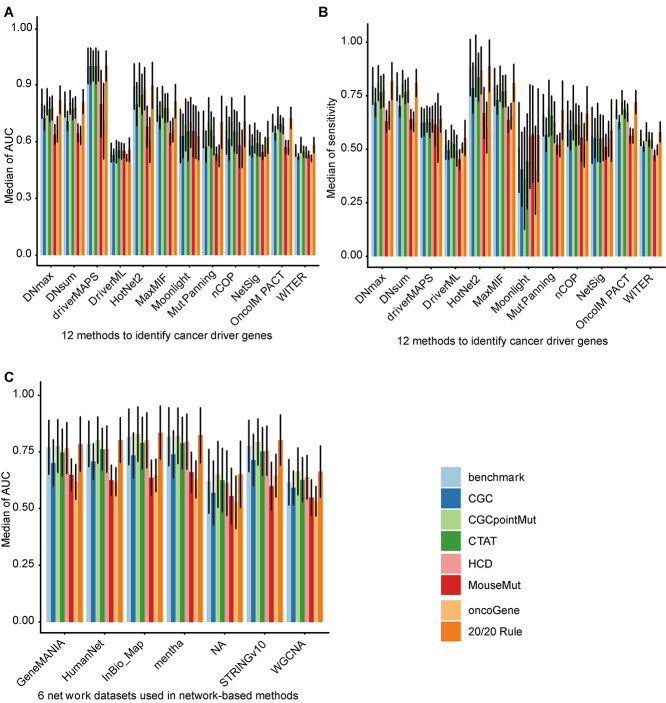
Figure 3.
Overall performance evaluation results of different methods and networks. The median of AUC and the median of sensitivity of 12 algorithms (A and B) and the median of AUC of six networks (C) are shown, based on somatic mutations of 36 cancer types from TCGA with eight benchmark datasets. 12 computational methods include DN_MAX, DN_SUM, driverMAPS, DriverML, HotNet2, MaxMIF, Moonlight, MutPanning, nCOP, NetSig, OncoIMPACT and WITER. Six network datasets include GeneMANIA, HumanNet, InBio_Map, mentha, STRINGv10 and WGCNA. The ‘NA’ in (C) represents the case where the non-network-based methods which do not use network data. The same group of ‘pillars’ represents the same algorithm (A and B) or network (C), and different colors in each group represent different benchmark sets for evaluating the algorithm (A and B) and networks (C). The error bars on each ‘pillars’ represent the standard deviation.

