
Figure 4.
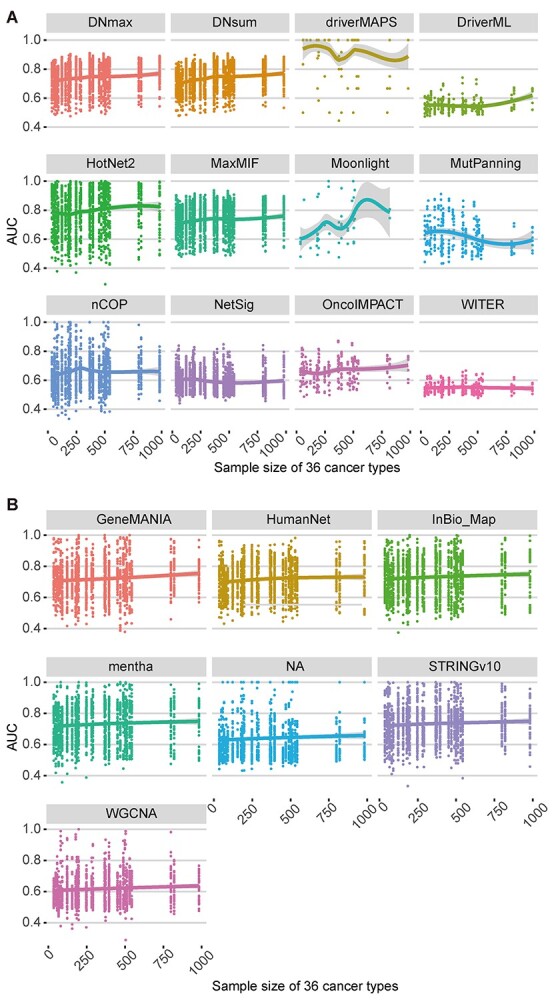
Effects of sample size on cancer driver gene identification for different computational methods and networks. The AUC of 12 algorithms (A) and 6 networks (B) based on somatic mutations of 36 cancer types from TCGA under different sample sizes with eight benchmark datasets are shown. Different algorithms (A) and networks (B) are displayed in different colors, and each point represents the AUC of corresponding algorithm (A) or network (B) under the corresponding sample size. Each dot plot has a smoothing scatterplot (LOESS) curve representing the performance trend. The ‘NA’ in (B) represents the case where the non-network-based methods which do not use network data.