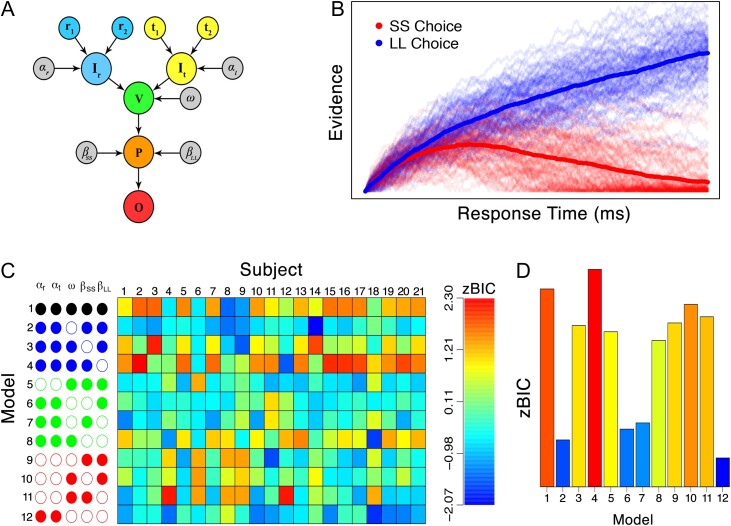
Figure 2.
Details of the model and fitting results. (A) The model takes as inputs information about the rewards (i.e., and ; blue nodes) and time delays (i.e., and ; yellow nodes), and converts these inputs to a subjective representation (i.e., and , respectively) through with parameters and . Features are selected with the parameter (i.e., the green node). Deliberation among the SS and LL alternatives is modulated by lateral inhibition parameters and (i.e., the orange node). Once an accumulator reaches a threshold amount of preference, a decision is made corresponding to the winning accumulator (i.e., the red node). (B) Example of how the model implements self-control-like behavior through lateral inhibition ( and ) and not valuation (). (C) Model fitting results in terms of a z-transformed BIC statistic separated by model constraint (rows) and subjects (columns), color coded according to the legend on the right. Empty circles indicate that a parameter was free to vary, whereas filled nodes indicate that a parameter was fixed. The model structures are grouped by the number of free parameters: black, blue, green and red indicate that a total of 3, 4, 5, and 6 free parameters were used, respectively. (D) Model fits from each model in (C), aggregated across subjects. For the zBIC, lower values (blue) indicate better model performance.

