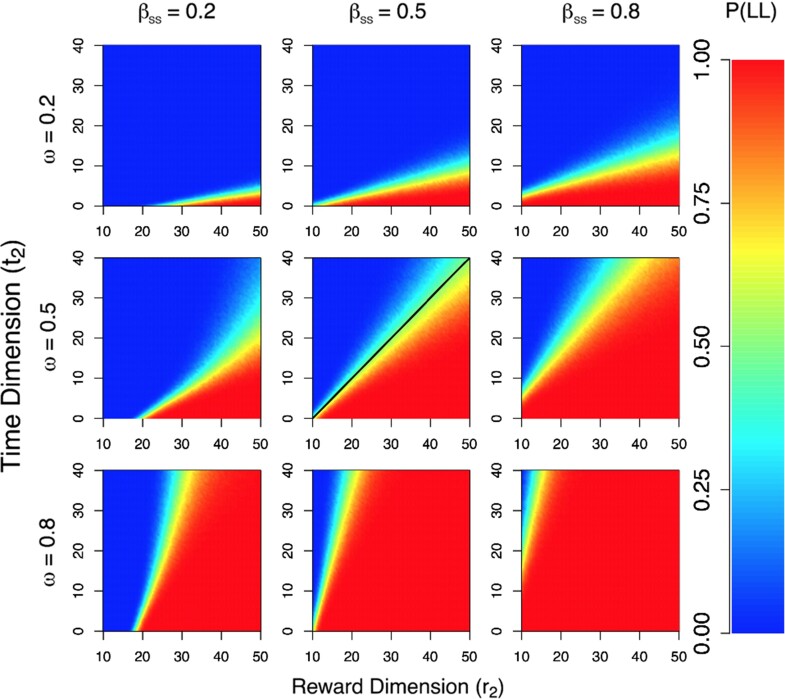
Figure 3.
Temporal discounting behavior in a mechanistic model. Results of a simulation study showing response probability as a function of different reward amounts (; x-axis) and time delays (; y-axis) for different values of the attention parameter (i.e., rows) and the lateral inhibition term for the SS alternative (i.e., columns). In each plot, the probability of choosing the LL choice is color coded according to the key in the right panel. In all simulations, the value of the SS choice was assumed to be fixed, where dollars and days. Lateral inhibition for the LL alternative was fixed to for comparison. The black line in the middle panel represents the line of indifference from a hyperbolic discounting model (see Equations (1 and 2)) with and .

