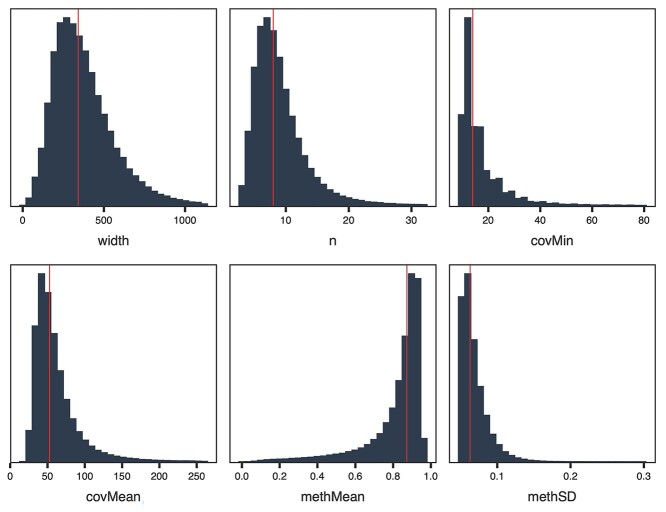
Figure 2.
After filtering of CpG clusters, most regions have similar characteristics. CpGs with sufficient coverage in WGBS were grouped into clusters of at least three CpGs separated by at most 150 bp and filtered for those with at least 10 reads in all samples and standard deviation > 0.05. Plots show the distributions of multiple region characteristics with the red line indicating the median value.

