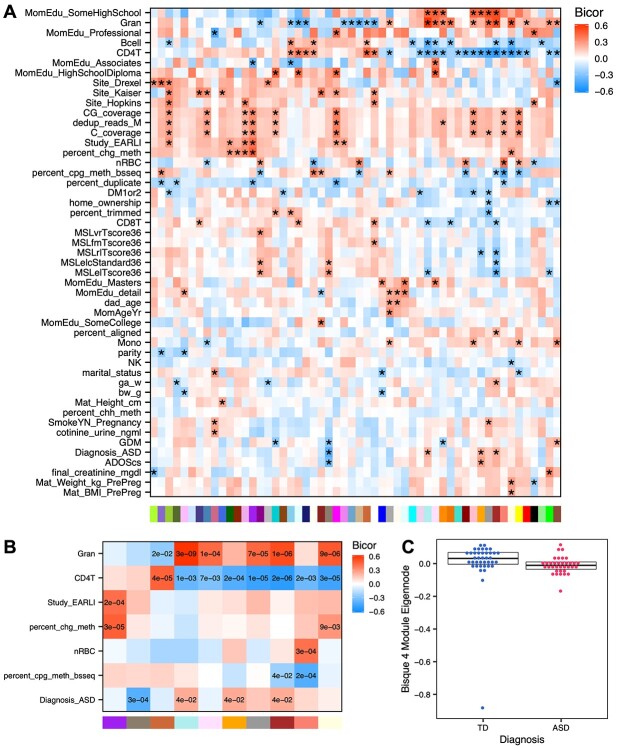
Figure 5.
Correlations of CpG cluster module eigennodes with sample traits. (A) All tested correlations between module eigennode values and sample traits using biweight midcorrelation (* unadjusted P < 0.05). (B) Same as (A) but highlighting top significant module-trait associations. (C) Bisque 4 module is associated with later ASD diagnosis. Eigennode values are plotted for each sample in relation to ASD diagnosis. Box indicates 1st quartile, median, and 3rd quartile.

