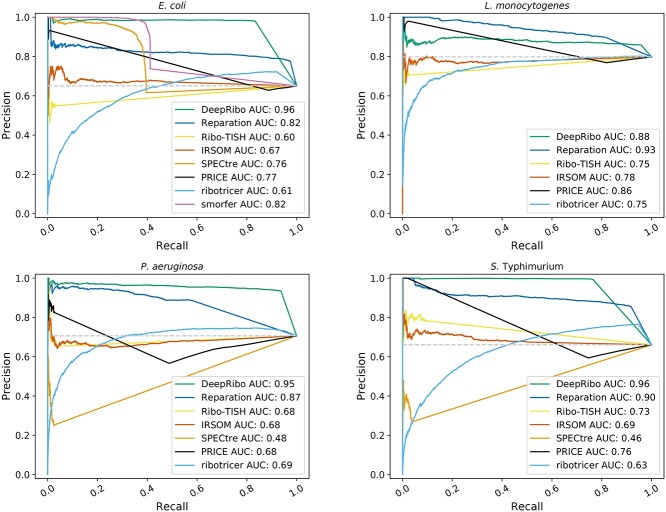
Figure 3.
PRCs for E. coli, L. monocytogenes, P. aeruginosa and S. typhimurium. Predictions were ranked according to the score provided by each tool (e.g. the probability for REPARATION_blast or the prediction rank for DeepRibo). A prediction was associated with a labeled ORF if more than a 70% overlap existed between the sequence of the prediction and the labeled ORF. If a labeled ORF had no prediction overlapping more than 70% of its coding region it is classified as not predicted. The ranked instances were then used to plot the PRC and to calculate the AUC. The gray baseline indicates how many predictions are expected to occur by chance.

