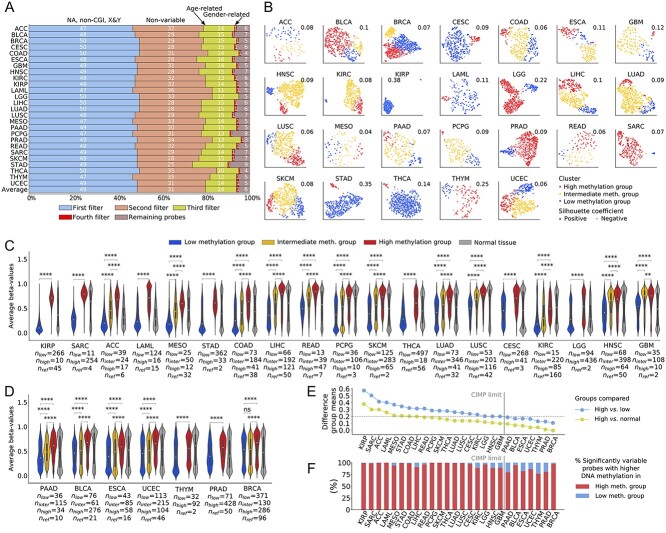
Figure 2.
Discovery of cancer types presenting characteristics of CIMP. (A) Percentage of probes removed by each filter. The first filter removed NA probes, probes not located on CGI (specifically CGIs, shores or shelves) and probes located on the X and Y chromosomes. The second filter removed nonvariable probes. The third filter removed potentially age-related probes. (B) UMAP representation of the results of spectral clustering based on purity-corrected DNA methylation values of filtered CpG probes. The groups are indexed according to their average beta-value over all significantly differentially methylated probes. Average silhouette coefficients are indicated at the top right of each cancer type. (C) Distribution of average beta-values over significantly differentially methylated probes for 19 CIMP-positive cancer types. (D) Distribution of average beta-values over significantly differentially methylated probes for seven CIMP-negative cancer types. Cancer types are ranked according to the difference in average beta-values between the high-methylation and low-methylation group. Significance is computed with a Kruskal–Wallis test. Distribution of beta-values for normal reference tissue is displayed in gray next to distribution of cancerous samples. Sizes of groups are indicated as nlow, ninter and nhigh for low, intermediate and high-methylation, respectively, with nref being the number of the normal reference samples. The white circle indicates the median and the inner box plot indicates the lower and upper quartile. Significance is reported for Bonferroni-corrected P. NS: P > 0.05; *: 0.01 ≤ P < 0.05; **: 0.001 ≤ P < 0.01; ***: 0.0001 ≤ P < 0.001; ****: P < 0.0001. (E) Percentage of probes hyper- or hypomethylated in the high- versus low-methylation group, computed on the set of probes significantly differentially methylated between groups. (F) Difference in mean beta-value between the high and low-methylation groups and high-methylation group and normal tissue, computed using all significantly differentially methylated probes. The cut-off value for CIMP-positiveness (0.2) is indicated by a horizontal line. BLCA: bladder urothelial carcinoma; BRCA: breast invasive carcinoma PAAD: pancreatic adenocarcinoma; READ: rectum adenocarcinoma; THYM: thymoma.

