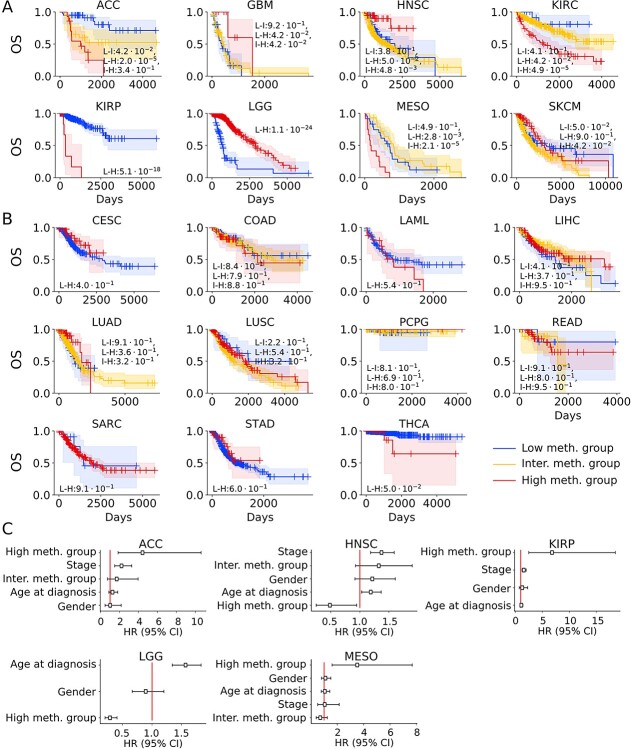
Figure 4.
CIMP as a prognostic factor for patients’ clinical outcome. (A) Kaplan–Meier representation of univariate overall survival (OS) analysis for eight cancer types with significant differences in OS between DNA methylation groups. (B) Kaplan–Meier representation for 11 cancer types without significant differences in OS between DNA methylation groups; 95% confidence interval (CI) is represented by a colored area around the Kaplan–Meier curve. The associated log-rank test P-value is indicated as low- versus high-methylation group (L-H), and when relevant, low versus intermediate (L-I) and intermediate versus high-methylation groups (I-H). (C) Cox regression model representation of hazards for significant associations. The hazard ratios (HR, with 95% CI) associated with each variable for all significant cancer types are represented. High-methylation group (resp. inter. meth. group) quantifies the hazard ratio associated with belonging to the high-methylation (resp. intermediate-methylation) as compared with the low-methylation group.

