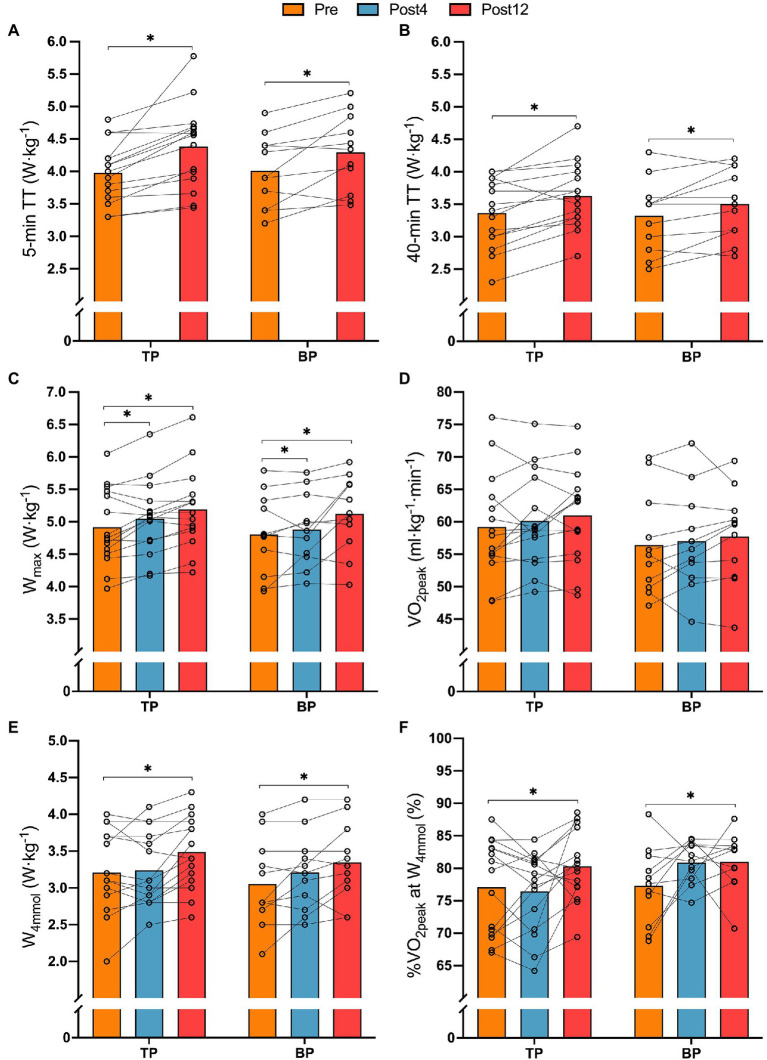
Figure 2.
Relative mean PO on 5-min TT (panel A), relative mean power output on 40-min TT (panel B), relative maximal aerobic power output (Wmax, panel C), relative peak oxygen uptake (VO2max, panel D), relative power output at 4 mmol·L−1 [BLa−] W·kg−1 (panel E), and fractional utilization of VO2peak at 4 mmol·L−1 [BLa−] (panel F) from before (Pre) to after 4- (Post4) and 12 weeks (Post12) of TP (n = 15) or BP (n = 11). *Indicates a main effect of time (p < 0.05).

