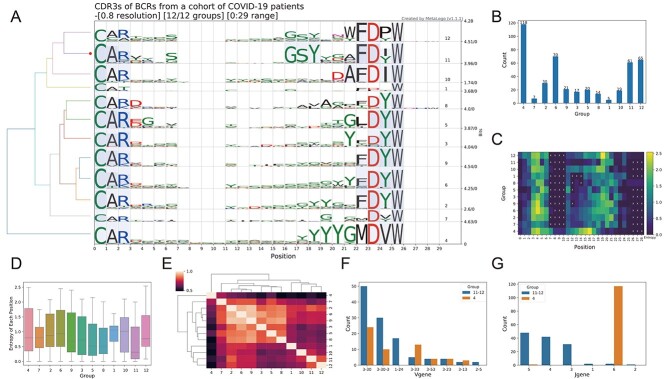
Figure 2.
Sequence logos and analysis results from MetaLogo on the BCR clonotypes. (A) Sequence logos for all the BCR clonotypes. The left tree indicates the relationships among groups. The red dot on the tree indicates the group to which the target sequence (first sequence of the input) belongs. Conserved positions among groups are connected by colored strips. (B) Sequence counts of each group. (C) Entropy heatmap of each group. ‘X’s represent gaps. (D) Boxplot of entropies of positions in all groups. (E) Clustering result of sequence logo groups to reveal the relationships among them. (F) The V gene annotation distribution for the group 11–12 (group 11 and group 12) and the group 4. (G) The J gene annotation distribution for the group 11–12 (group 11 and group 12) and the group 4.

