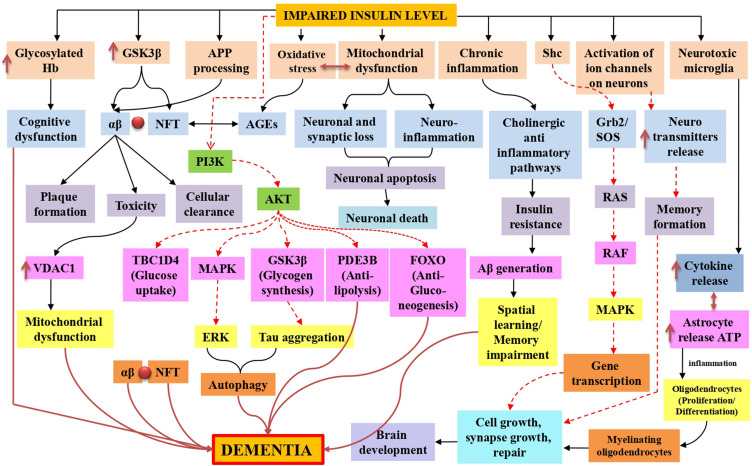
Figure 2.
Insulin resistance in dementia is represented schematically by mitochondrial dysfunction, which leads to synaptic damage and neurodegeneration, glycosylated haemoglobin in intoxicated cognitive function due to failure in glucose transport for neurons, oxidative stress-induced amyloid beta and phosphorylated tau lineups via advanced glycation end products, inflammation caused by mitochondrial dysfunction and toxicities of amyloid-beta and glycation end products. Additionally, in both normal and impaired insulin signaling, Tau hyperphosphorylation was also observed, stimulates AKT, and inhibits tau hyperphosphorylation by inactivating GSK-3. Furthermore, the TOR pathway was also active for cellular growth and kept autophagy at a low level for cellular function. Black normal flow lines represent normal working mechanism; dotted red lines show inhibition of the pathway, and normal dark red flow lines show the overall cause of dementia.

