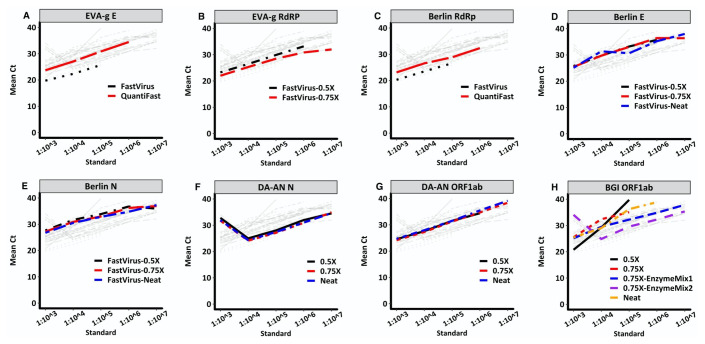
Figure 1. Standard curves of 10-fold dilutions and their corresponding Ct values resulting from titrating RT-PCR reagents from four assays.
Charité Berlin assay targeting E gene ( D), N gene ( E) and RdRp gene ( A); EVA-g, targeting E gene ( B) and RdRp gene ( C); DAAN, targeting N gene ( F) and ORF1ab region ( G) and BGI, targeting ORF1ab region ( H). All assays indicated “Neat” used half the concentration of the recommended assay volume and those indicated “0.5X” or “0.75X” used 0.5 times and 0.75 times the volume of the “Neat” assay volume, respectively. The primer-probe set assays are used alongside commercial RT-PCR kits TaqMan® Fast Virus 1-Step Master Mix and QuantiFast Multiplex RT-PCR +R Kit. In the BGI assays (panel H), “EnzymeMix1” and “EnzymeMix2” assays were similar to the “0.75X” assay, however, the enzyme mix volumes used were 0.5ul and 0.25ul, respectively. The light grey lines in each plot illustrate comparisons of all other assays versus the respective coloured plot assay.

