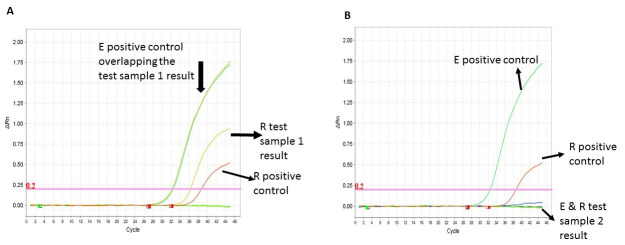
Figure 2. Amplification curves of the two target gene approach.
The EVAg E and Berlin RdRp assays were run under the same RT-PCR conditions in the same PCR 96-well plate. ( A) Shows a definitive positive result for test sample 1 for the E target region (orange line, Ct 32.2) underlying the green line (the E positive control, Ct 32.4) and the R region (yellow line, Ct 36.3) and R positive control (red line, Ct 38.7). ( B) Shows a definite negative result for test sample 2 with no amplification curves when compared to the E positive control (green line) and the R positive control (red line).

