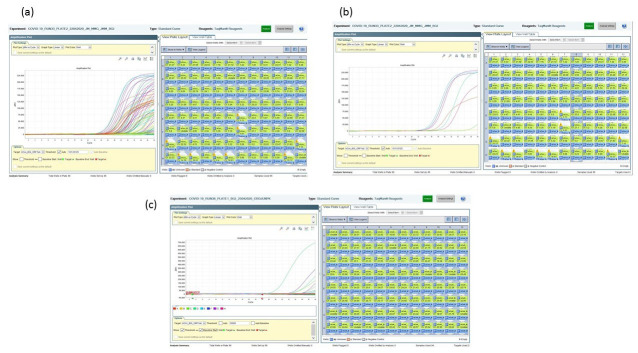
Figure 3. BGI assay amplification plots using 50% of the manufacturer’s recommendation.
( A) The multicoloured curves indicate a large number of positive results from a 96 sample test run. ( B) A zoom in on a single column of 8 test samples indicates at least 6 test samples as being SARS-CoV-2 positive. ( C) Following the use of 75% of neat volumes and 0.25µl of the enzyme mix showed improved sensitivity in the assay as indicated from the 96 sample test run with. Only 4 samples testing positive using a Ct cut-off of <34.

