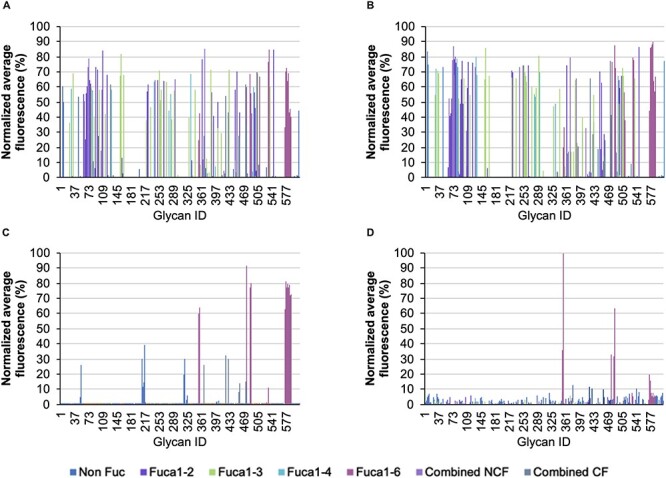
Fig. 1.

Relative average binding intensities of (A) AOL, (B) AAL, (C) LCA and (D) Pholiota PhoSL to glycan structures contained in the mammalian glycan arrays from the CFG v5.0 for AOL, ALL and LCA and CFG v.5.1 for PhoSL. Glycan signals without fucosylation are colored in blue, those containing α(1,2)Fuc are colored in purple, those containing α(1,3)Fuc are colored in green, those containing α(1,4)Fuc are colored in cyan, those containing α(1,6)Fuc are colored in fuchsia, those containing at least two different fucoses, but not core fucose are colored in lavender and those containing at least two different fucoses, one of it in the core position, are colored in metallic gray.
