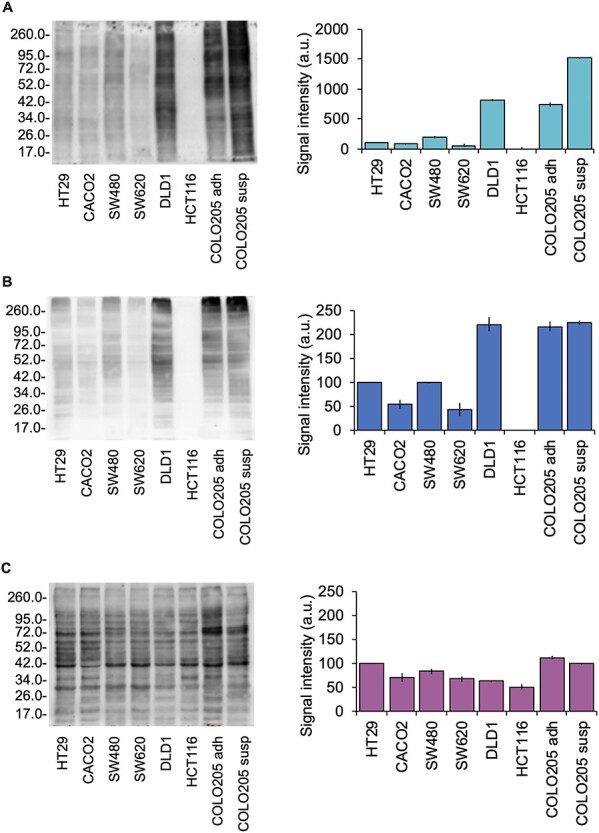
Fig. 5.

Lectin blot from a selection of 8 CRC cell lines at different tumor stages and fucosylation expression. COLO205 was harvested in two fractions (adherent subclones, adh, and suspension-growing subclones, susp) from the same cell culture. Representative lectin blots using (A) AAL (cyan), (B) LCA (blue) and (C) PhoSL (fuchsia) were performed from the same protein extracts and at the same protein content. Plot bars next to each figure represent the mean relative chemiluminiscence intensity using Coomassie R-250 dyer as protein loading control ± standard deviation from three experiments.
