Figure 2.
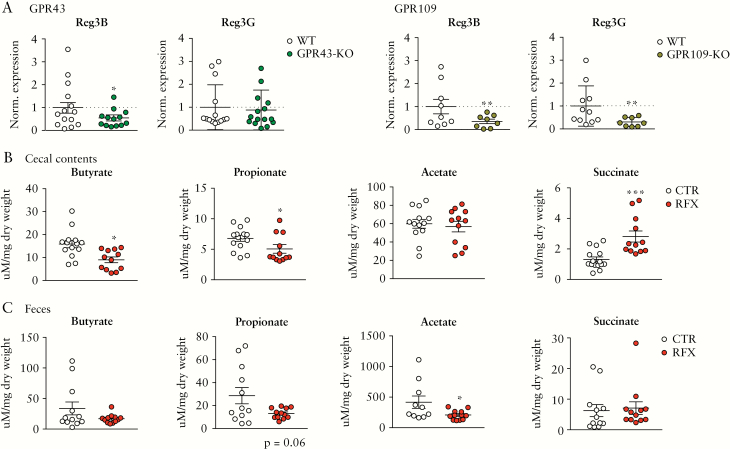
Reg3 expression in GPR43 and GPR109-KO mice and luminal SCFA reduction after antibiotic treatment. [A] mRNA levels of Reg3B or -G expression in the caecum of GPR43- [left] and GPR109-KO mice [right] mice compared to WT controls. [B] Caecal luminal contents of butyrate, propionate, acetate and succinate after RFX treatment measured by 1H-NMR. [C] Levels of butyrate, propionate, acetate and succinate analysed in faeces after RFX treatment. Data are means ± SEM. *p < 0.05, ***p < 0.001; n = 8–15 mice per group.

